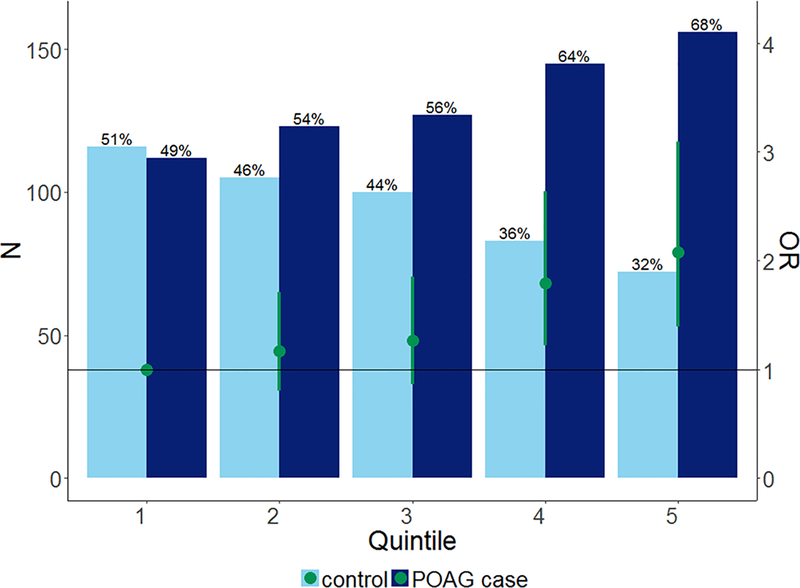
Fig. 1.
Genetic Risk Score. Genetic risk score based on the 15 known POAG-loci identified in Europeans and Asians GWAS (rs1192415, rs28504591, rs4619890, rs2745572, rs11969985, rs4236601, rs284489, rs10712703, rs2472493, rs58073046, rs7137828, rs10483727, rs3785176, rs9897123, rs16984299). Participants were grouped into quintiles of the genetic risk scores. Green circles represent the POAG odds ratio (adjusted for age, sex and principal components) when comparing each quintile to the lowest quintile (Q1 = reference line). The green-capped lines represent 95% CI of the POAG odds ratios. Bars represent the percentage of POAG cases (dark blue) and controls (light blue) per quintile.

