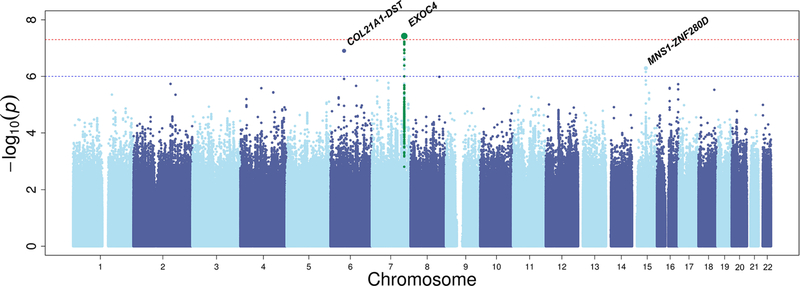
Fig. 3.
Manhattan plot for the association of genome-wide SNPs with primary open-angle glaucoma in GIGA BioMe meta-analysis. Manhattan plot of the GWAS meta-analysis of GIGA and BioMe (N=1113cases/N = 1826 controls). The figure shows −log10-transformed P values for all SNPs. The upper dotted horizontal line represents the genome-wide significance threshold of P < 5.0 × 10⁻⁸; the lower dotted line indicates a P value of 1 × 10⁻⁶. Green dots represents variants in that are in linkage disequilibrium (r2 > 0.6 1000 Genomes African ancestry) with the top SNP rs141186647.

