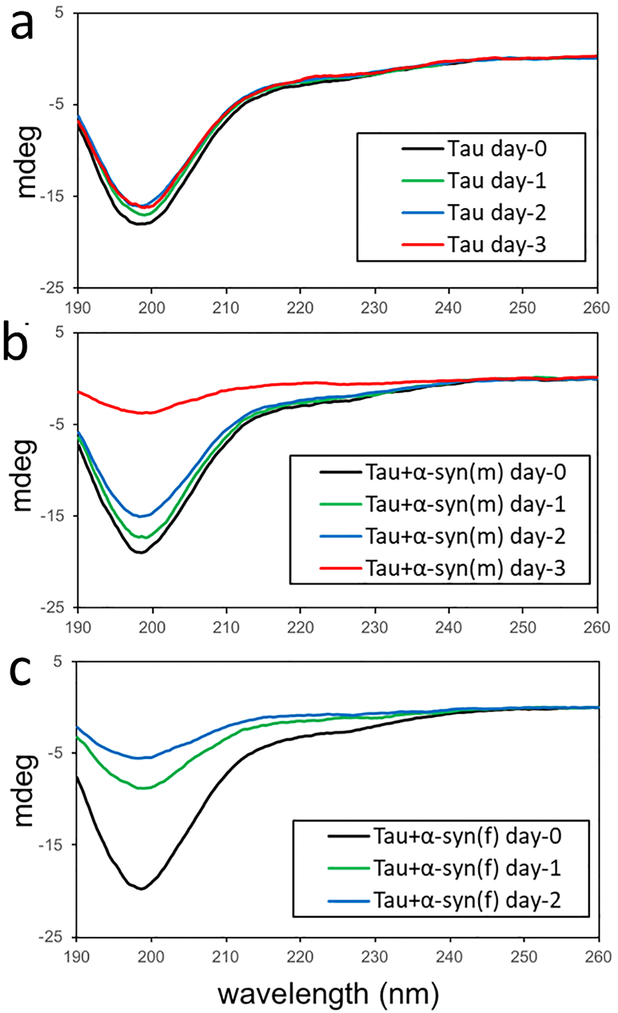
Figure 4.
CD spectra of pure tau (10 μM) (a), a mixture of tau (10 μM) and α-synuclein monomer (1 μM) (b), and a mixture of tau (10 μM) and α-synuclein filaments (1 μM, monomer concentration) (c) acquired at different incubation times. The CD signal of the mixtures decreased due to the precipitation of the protein aggregates.

