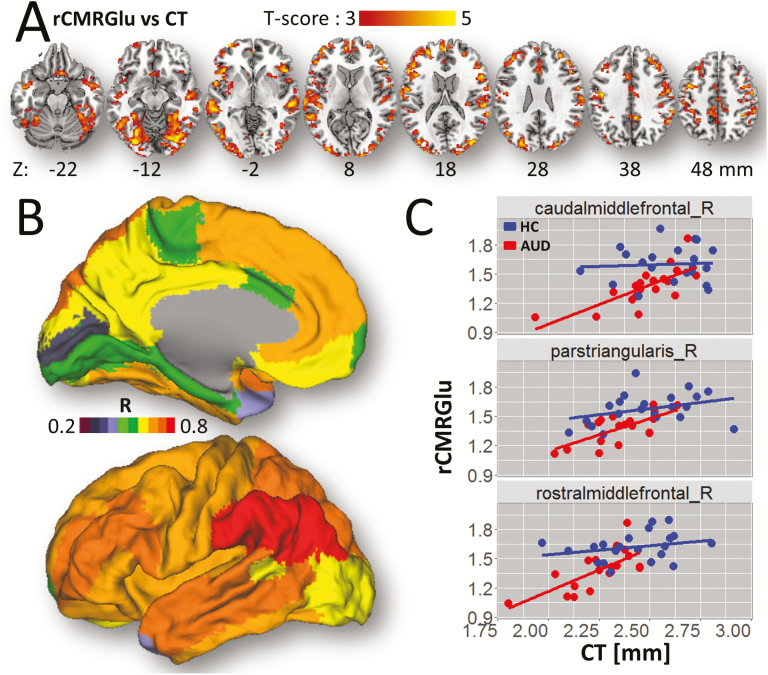
Figure 4.
rCMRGlu-cortical thickness (CT) association. (A) Statistical significance of the effect of CT-related increases in relative glucose metabolism (rCMRGlu). (B) FreeSurfer regions of interest (ROI) analyses showing the correlation factors between rCMRGlu and CT within the anatomical partitions overlaid on medial and lateral surface views of the PALS-B12 template. (C) Scatter plots showing this association for 3 representative frontal ROIs for alcohol use disorder (AUD) participants and healthy controls (HC). Statistical model: ANCOVA with age as a covariate of no interest. Statistical imaging threshold of P < .005.

