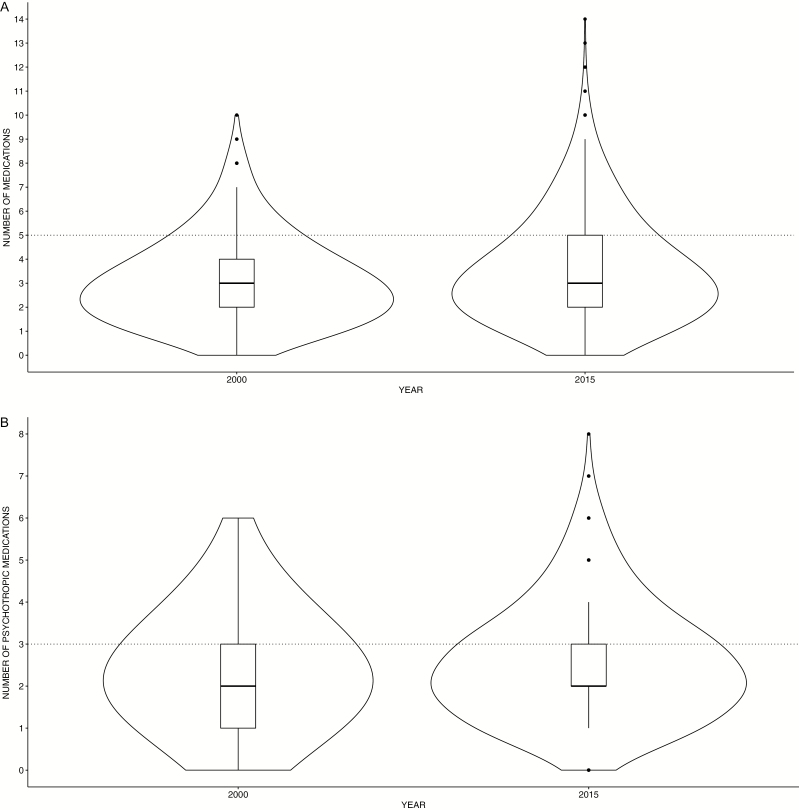
Figure 3.
Polypharmacy. (A) Violin plots of the total number of simultaneously prescribed drugs in 2000 and 2015. The boxplot in the center of the violin plot shows the median concurrently prescribed drug and the interquartile range, the thin black line represents the 95% confidence interval. In addition, the displayed area represents a kernel density estimate to indicate the distribution form of the prescription data. The thin dotted line shows the threshold of 5 drugs, from which polypharmacy starts. (B) Psychiatric polypharmacy. Violin plots of the total number of simultaneously prescribed psychotropic drugs in 2000 and 2015. The white boxplot in the center of the violin plot shows the median simultaneously prescribed psychotropic drugs. The thick grey bar in the middle represents the interquartile range, the thin black line represents the 95% confidence interval. In addition, the displayed area represents a kernel density estimate to indicate the distribution form of the prescription data. The thin dotted line shows the threshold of 3 psychopharmacological drugs, indicating psychiatric polypharmacy.

