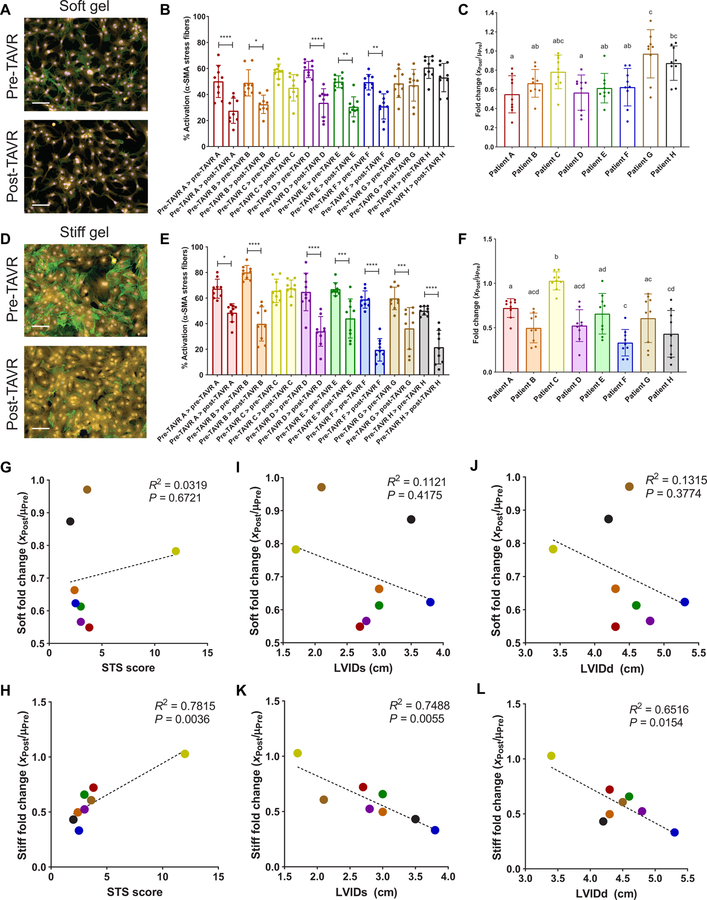
Fig. 6. Post-TAVR serum deactivates cardiac myofibroblasts activated with pre-TAVR serum on soft and stiff hydrogels.
(A) Representative images and (B) percentage of activated ARVFs on soft hydrogels treated initially with pre-TAVR serum and subsequently with either pre-TAVR or post-TAVR serum. (C) Fold change of ARVF deactivation on soft hydrogels in post-TAVR serum (XPost values) normalized to the mean activation in pre-TAVR serum from the same patient (µPre). (D) Representative images and (E) percentage of activated ARVFs on stiff hydrogels treated initially with pre-TAVR serum and subsequently with either pre-TAVR or post-TAVR serum. (F) Fold change of ARVF deactivation on stiff hydrogels in post-TAVR serum (XPost values) normalized to the mean activation in pre-TAVR serum from the same patient (µPre). (G and H) Scatter plots of fold change in ARVF deactivation on (G) soft and (H) stiff hydrogels versus patient STS scores. (I and J) Scatter plots of patient fold change in ARVF deactivation on soft hydrogels versus (I) LVIDs and (J) LVIDd measurements. (K and L) Scatter plots of fold change in ARVF deactivation on stiff hydrogels versus patient (K) LVIDs and (L) LVIDd measurements. Stained images: green, α-SMA; yellow, cytoplasm; blue, nuclei. Scale bars, 100 µm. For all bar graphs, n = 9 measurements per group, means ± SD shown, and significance tested with one-way ANOVA for all data and indicated as *P < 0.05, **P < 0.01, ***P < 0.001, ****P < 0.0001, or groups with different letters indicate statistical significance (P < 0.05).

