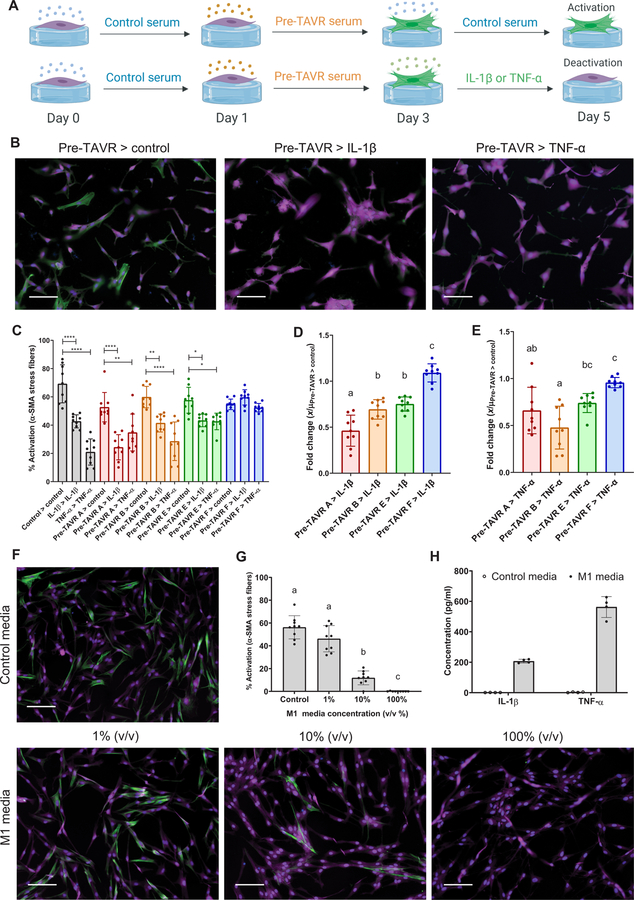
Fig. 7. Inflammatory macrophage factors identified in post-TAVR serum mediate myofibroblast deactivation on stiff hydrogels.
(A) Schematic of myofibroblast deactivation experiments with IL-1β or TNF-α (created with BioRender). (B) Representative images and (C) percentage of activated porcine VICs treated with pre-TAVR serum (n = 4 different patients), followed by treatments with control media, IL-1β (10 ng/ml), or TNF-α (10 ng/ml). (D and E) Patient-specific fold changes in (D) IL-1β– or (E) TNF-α–mediated deactivation in VICs initially activated with pre-TAVR serum (n = 4 patients). (F) Representative images and (G) percentage of activated VICs treated with proinflammatory M1 macrophage conditioned media at varying dilutions. (H) IL-1β and TNF-α concentrations in control and M1 macrophage conditioned media measured with ELISA. Stained images: green, α-SMA; magenta, cytoplasm; blue, nuclei. Scale bars, 100 µm. For all bar graphs, n = 9 measurements per group, means ± SD shown, and significance tested with one-way ANOVA for all data and indicated as *P < 0.05, **P < 0.01, ****P < 0.0001, or groups with different letters indicate statistical significance (P < 0.05).

