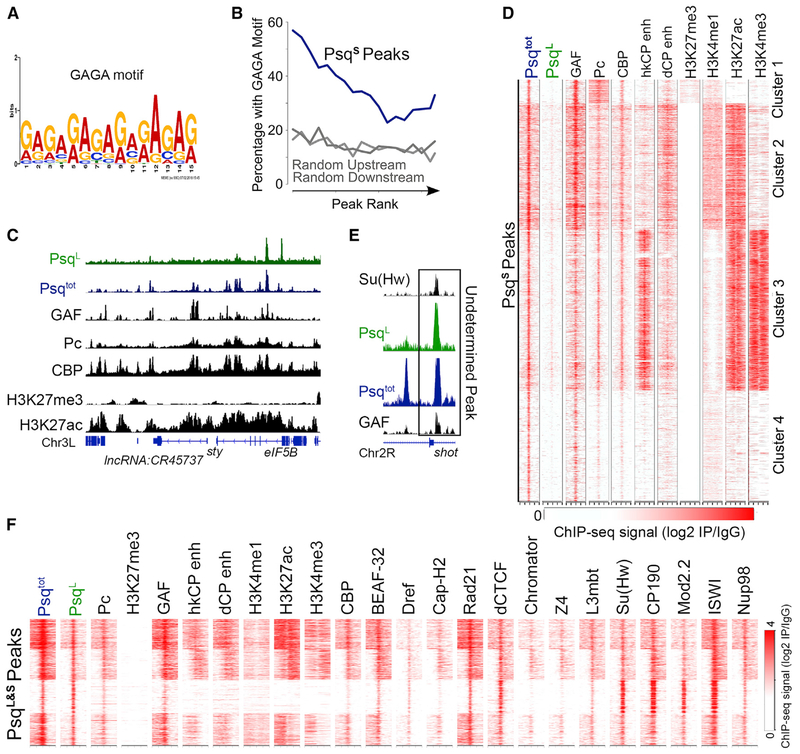
Figure 2. The PsqS Isoform Colocalizes with Pc and GAF at Active Enhancers in Kc167 Cells.
(A) Binding motif detected by multiple expectation maximization (EM) for motif elicitation designed to analyze ChIP-seq (MEME-ChIP) at PsqS peaks.
(B) Percentage of PsqS peaks that overlap GAGA motifs ranked by ChIP-seq signal intensity (blue). Regions upstream and downstream of PsqS summits were tested for comparison (gray).
(C) Example region showing PsqS binding sites as peaks with a Psqtot signal (blue), without a PsqL signal (green), and colocalizing with GAF, Pc, CBP, and H3K27ac (black).
(D) Heatmap showing ChIP-seq signal for various proteins or histone modifications surrounding PsqS binding sites ± 2 kb. n = 6,386. The STARR-seq signal is from S2 cells, and the ChIP-seq signal is from Kc167 cells and is shown relative to IgG.
(E) IGV track showing an example locus with ChIP-seq signal for PsqL and Psqtot overlapping with both Su(Hw) and GAF.
(F) ChIP-seq signal for various proteins and histone modifications in a 2-kb region surrounding sites enriched in PsqL and Psqtot. n = 2,130. The STARR-seq signal is from S2 cells, and the ChIP-seq signal is from Kc167 cells and is shown relative to IgG.
See also Figure S2.

