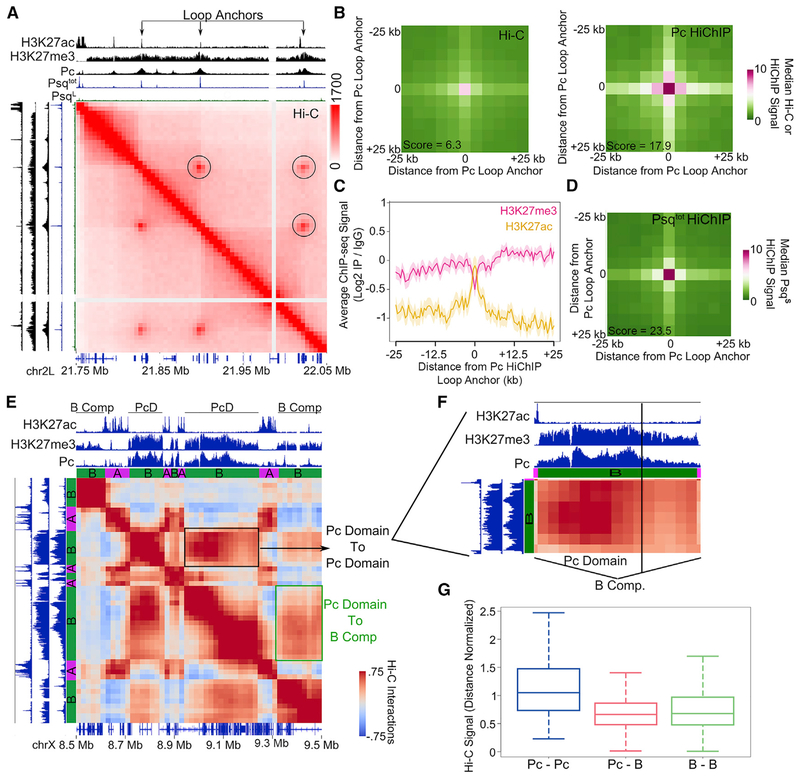
Figure 3. Pc Loop Anchors Contain PsqS and Form Interactions Distinct from Those Involving Pc-Repressive Domains.
(A) Example locus showing Hi-C in Kc167 cells signals for loops associated with Pc (circles). Tracks showing ChIP-seq for H3K27ac, H3K27me3, Psqtot, and Pc are shown above and to the left. Genes are shown at the bottom.
(B) 2D metaplots of Hi-C (left) and Pc HiChIP (right) data centered on significant interactions called by Pc HiChIP. n = 206. The score indicates the enrichment of the center pixel compared with the top left corner.
(C) Average ChIP-seq profile for H3K27ac (orange) and H3K27me3 (pink) surrounding Pc loop anchors identified by Pc HiChIP. n = 206. The shaded area indicates SD.
(D) 2D metaplot of Psqtot HiChIP data centered on significant interactions called by Pc HiChIP. n = 206. The score indicates the enrichment of the center pixel compared with the top left corner.
(E) Hi-C interaction plot showing an example locus in which two distinct Pc domains interact more strongly with each other (black box) than with other inactive B compartmental domains (green box). Tracks showing H3K27ac, H3K27me3, Pc, and A or B compartmental domains are shown above and to the left.
(F) Zoomed-in area of the Pc domain shown in (E).
(G) Boxplot showing the distribution of average interaction signals occurring between Pc domains (Pc-Pc, n = 102), between Pc domains and other inactive B compartmental domains (Pc-B, n = 1,365), or between inactive B compartmental domains (B-B, n = 17,208). p < 0.001, Wilcoxon test for Pc-Pc versus Pc-B.
See also Figure S3.

