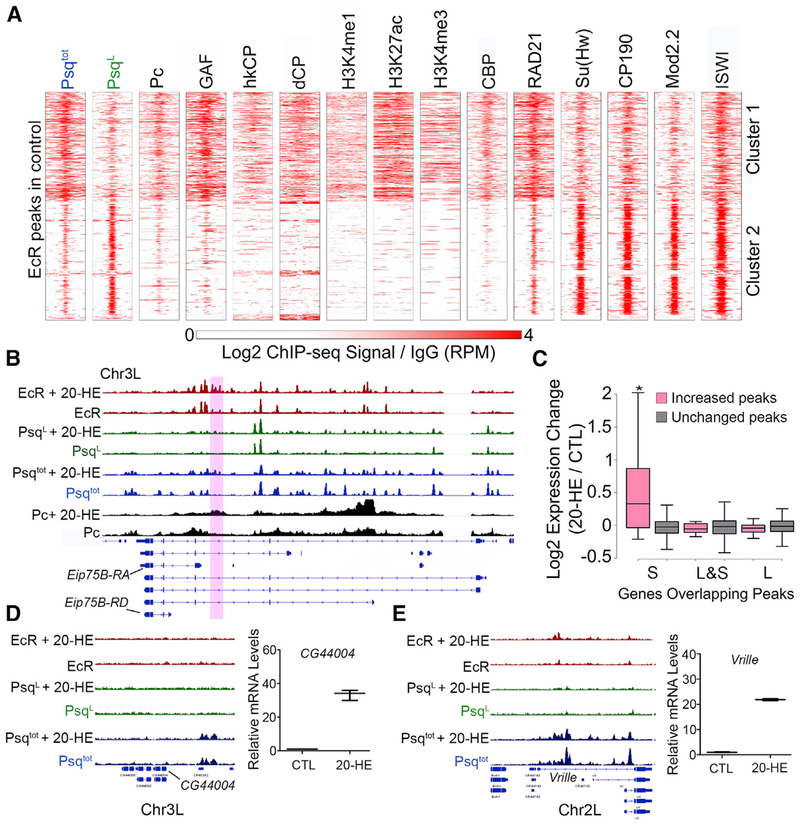
Figure 4. Psq Colocalizes with EcR at Ecdysone-Induced Genes.
(A) ChIP-seq signal in Kc167 cells for various proteins and histone modifications in a 2-kb region surrounding EcR sites. n = 845. The ChIP-seq signal is shown relative to IgG.
(B) IGV tracks showing the ChIP-seq signal before and after 20-HE treatment for EcR (red), PsqL (green), Psqtot (blue), and Pc (black). The purple box highlights a region where binding is altered after ecdysone treatment.
(C) Fold expression changes for genes with overlapping Psq peaks that increase (pink) or are unchanged (gray) after ecdysone treatment. *p < 0.01, Wilcoxon test.
(D) Left: IGV tracks showing the ChIP-seq signal before and after 20-HE treatment for EcR (red), PsqL (green), and Psqtot (blue). Right: expression change of CG44004 after 20-HE treatment relative to the control (CTL) as measured by qPCR.
(E) Left: IGV tracks showing ChIP-seq signal before and after 20-HE treatment for EcR (red), PsqL (green), and Psqtot (blue). Right: expression change of Vrille after 20-HE treatment relative to the control (CTL) as measured by qPCR.
See also Figure S4.

