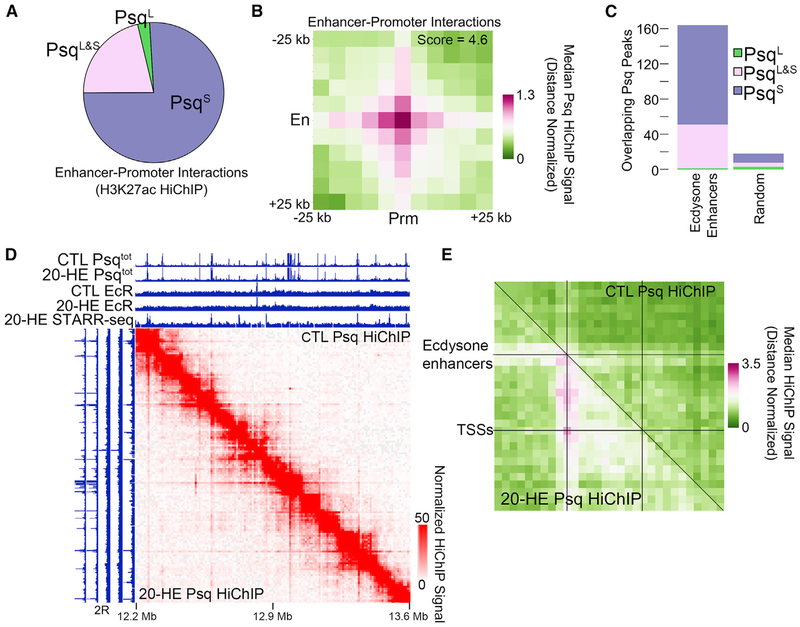
Figure 5. PsqS-Bound Enhancer-Promoter Interactions Are Altered during the Ecdysone Response.
(A) Pie graph showing the relative binding of PsqS (purple), PsqL (green), and PsqL&S (pink) at enhancer-promoter interaction anchors determined by H3K27ac HiChIP in Kc167 cells. n = 94,483 interactions.
(B) 2D metaplot of Psq HiChIP signal around enhancer-promoter interactions determined by H3K27ac HiChIP found in (A). En, enhancers; Prm, promoters.
(C) Number of STARR-seq ecdysone enhancers (left) compared with random loci (right) that overlap PsqS (purple), PsqL (green), and PsqL&S (pink).
(D) Psq HiChIP data in a 1-Mb region of chromosome 2R showing changes in the interaction profile after ecdysone treatment (bottom left) compared with the control (top right). ChIP-seq tracks showing PsqS and EcR before (CTL) and after 20-HE treatment. The STARR-seq signal after ecdysone treatment is also shown.
(E) 2D metaplot of Psq HiChIP data before (top right) and after (bottom left) ecdysone treatment. Regions between STARR-seq ecdysone enhancers and nearby differentially expressed genes were scaled to equally sized bins. n = 86.
See also Figure S5.

