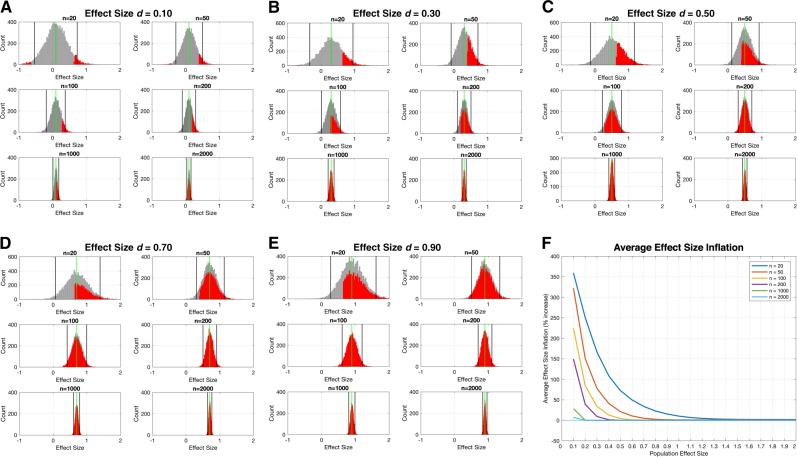
Fig. 3.
Simulation of sample effect size estimates at different sample sizes and across a range of true population effects for a hypothetical case–control study. In this simulation we set the population effect size to a range of different values, from very small (e.g., d = 0.1) to very large (e.g., d > 1.0) (panels a–e show simulation results when effect size ranges from d = 0.1 to d = 0.9 in steps of 0.2). We then simulated data from two populations (cases and controls), each with n = 10,000,000, that had a case–control difference at these population effect sizes. Next, we simulated 10,000 experiments where we randomly sampled from these populations different sample sizes (n = 20, n = 50, n = 100, n = 200, n = 1000, n = 2000) and computed the sample effect size estimate (standardized effect size, Cohen’s d) for the case–control difference. These histograms (gray) show how variable the sample effect size estimates are (black lines show 95% confidence intervals) relative to the true population effect size (green line). Visually, it is quite apparent how small sample sizes (e.g., n = 20) have wildly varying sample effect size estimates and that this variability is consistent irrespective of what the true population effect size is. Overlaid on each gray histogram are red histograms that show the distribution of sample effect size estimates where the hypothesis test (e.g., independent samples t-test) passes statistical significance at p < 0.05. The rightward shift in this red distribution relative to the true population effect size (green line) illustrates the phenomenon of effect size inflation. The problem is much more pronounced at small sample sizes and when true population effects are smaller. We then computed what is the average effect size inflation for this red distribution and plotted this average effect size inflation as a percentage increase relative to the true population effect in (f). Each line in panel f refers to simulations with different sample sizes. This plot directly quantifies the degree of effect size inflation across a range of true population effects and across a range of sample sizes. The code for implementing and reproducing these simulations is available at https://github.com/mvlombardo/effectsizesim

