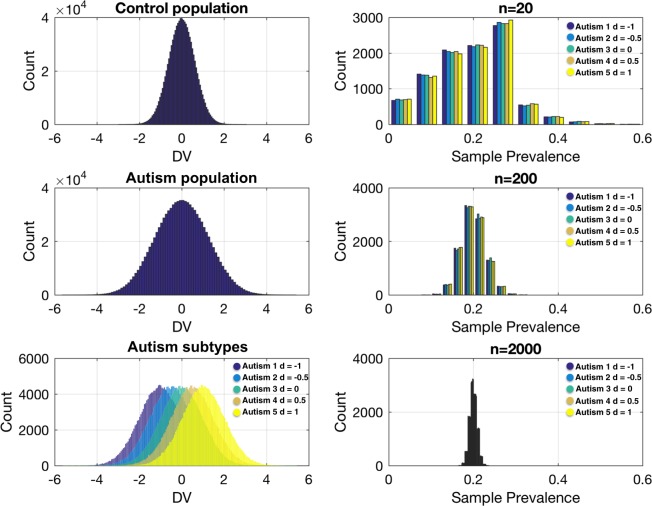
Fig. 4.
Simulation showing sampling variability and bias of enrichment of specific strata in small sample size studies. In this simulation we generated a control population (n = 1,000,000) with a mean of 0 and a standard deviation of 1 on a hypothetical dependent variable (DV). We then generated an autism population (n = 1,000,000) with 5 different autism subtypes each with a prevalence of 20% (e.g., n = 200,000 for each subtype). These subtypes vary from the control population in effect size in units of 0.5 standard deviations, ranging from −1 to 1. This was done to simulate heterogeneity in the autism population that is reflective of very different types of effects. For example, the autism subtype 5 shows a pronounced increased response on the DV, whereas autism subtype 1 shows a pronounced decreased response on the DV. Across 10,000 simulated experiments, we then randomly sampled from the autism population sample sizes of n = 20, n = 200, and n = 2000, and computed the sample prevalence of each autism subtype. The ideal result without any bias would be sample prevalence rates of around 20% for each subtype. This 20% sample prevalence is approached at n = 2000, and to some extent at n = 200. However, small sample sizes such as n = 20 shows large variability in sample prevalence rates of the subtypes and this can markedly bias the results of a case–control comparison. The code for implementing and reproducing these simulations is available at https://github.com/mvlombardo/effectsizesim

