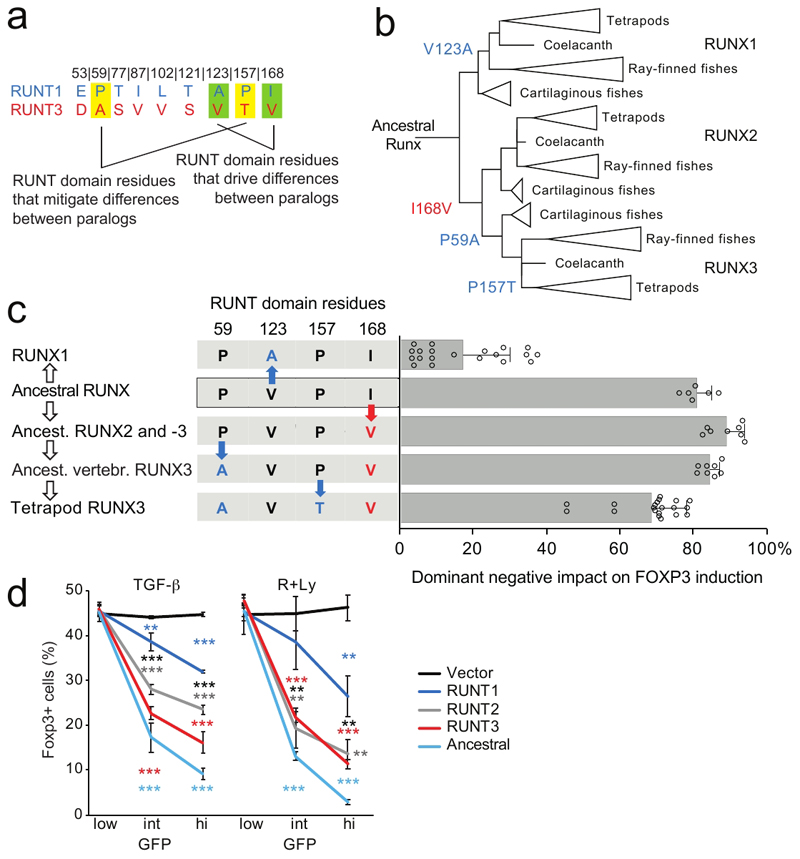
Fig. 7. Runt domain evolution towards sub-maximal strength.
a) Amino acid residues that specify functional differences between RUNX1 and -3.
b) Evolution of RUNT domains. Residues 59, 123, 157 and 168 are highlighted. See text for details. The reconstructed ancestral RUNT domain features residues P59, V123, P157 and I168.
c) Functional evolution of RUNT domain residues. Red and blue letters and arrows indicate amino acid substitutions that increase or reduce RUNT domain activity (n = 6 to 20, mean ± SD of 3 to 10 independent experiments. The X axis shows the dominant negative impact of each construct on Foxp3 induction: at 0% dominant negative activity, the number of Foxp3-expressing cells is the same as for control vector, at 100% dominant negative activity there are no Foxp3-expressing cells. Constructs to test the activity of the ancestor of Runx2 and -3 and early vertebrate Runx3 contained P59, L102 and T121, which in the context of the ancestral RUNT domain were functionally equivalent to E53, L102, and T121 (Supplementary Fig. 8a). See Supplementary Fig. 3a for sequences. Two-tailed Student's T test RUNT3 versus early vertebrate Runx3: P = 9.52 x 10⁻⁵, RUNT3 versus ancestor of Runx2 and -3 P = 4.84 x 10⁻⁶, RUNT3 versus RUNT domain of putative ancestral Runx: P = 0.0055, RUNT3 versus RUNT1 P = 4.89 x 10⁻¹⁷.
d) Functional comparison of the putative ancestral RUNT domain with the RUNT domains of present-day RUNX1, -2 and -3. Mean ± SD of 3 independent experiments * P<0.05, ** P<0.01, *** P<0.001 by two-tailed T test between RUNT1 and -3 (black), RUNT1 and control vector (blue), RUNT3 and control vector (red).

