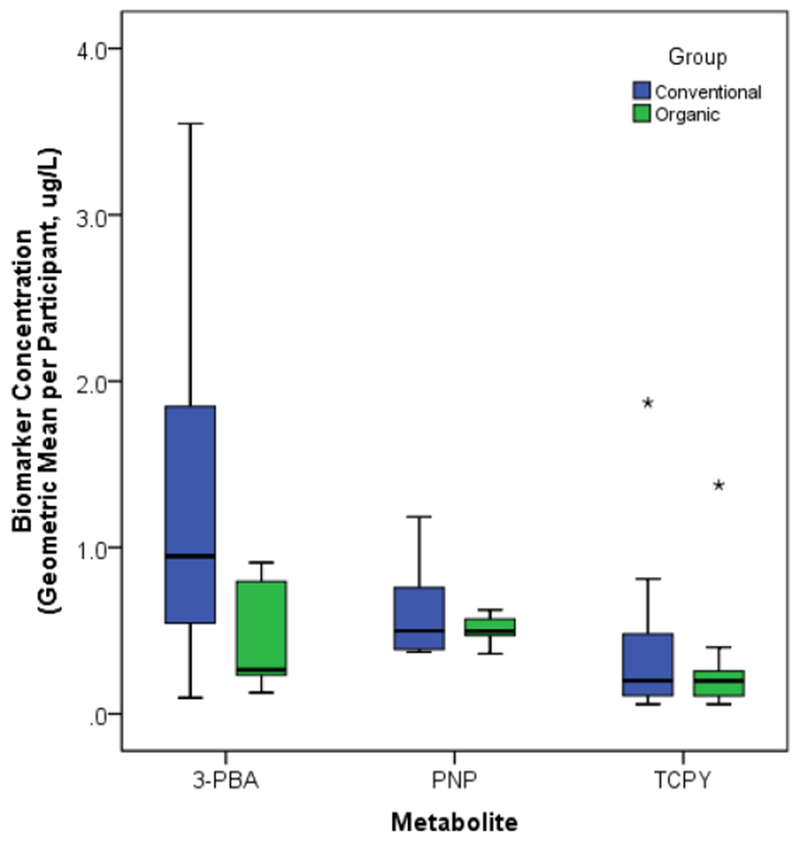
Figure 2.

Distribution of participants’ long-term exposure, estimated as the geometric mean of the concentrations in all monthly composite samples collected throughout the second and third trimesters of pregnancy, by intervention group assignment. Boxes extend from the 25th to the 75th percentile, horizontal bars indicate the medians, whiskers extend 1.5 times the length of the interquartile range above and below the 75th and 25th percentiles, and outliers are represented as asterisks (*). 3-PBA concentrations were significantly higher among participants in the conventional as compared to the organic group (p=0.03); no significant difference was found for PNP or TCPY.
