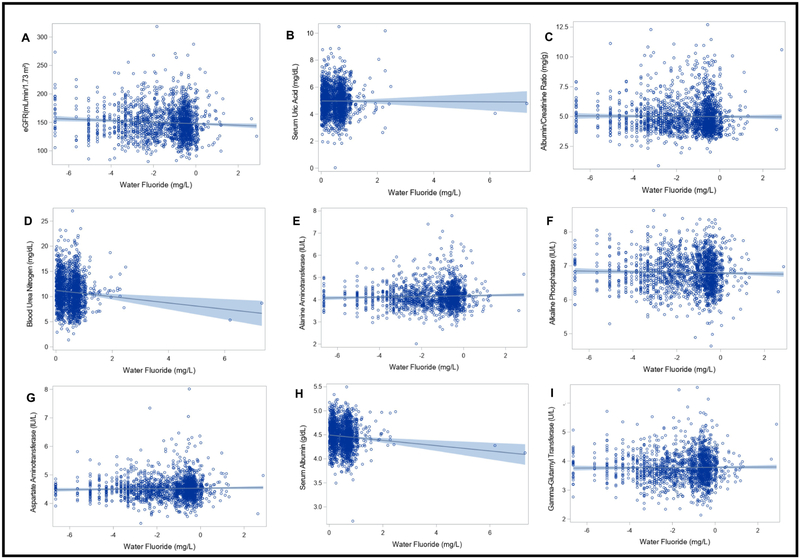
Figure 2. Associations between water fluoride and kidney and liver measures.
Each figure depicts a regression line with 95% confidence intervals; circles represent individual data points. Sample weighted regression analyses were adjusted for age, sex, race, body mass index, ratio of family income to poverty and daily protein intake (Participants who reported not drinking tap water were excluded; N = 23,287,332; unweighted n = 1742). Water fluoride and outcome variables were log2 transformed for analyses with albumin/creatinine ratio, alanine aminotransferase, alkaline phosphatase, aspartate amino transferase and gamma-glutamyl transferase. Water fluoride was log2 transformed for the analysis with eGFR. Cook’s distance estimates were used to test for influential data points; none were identified.

