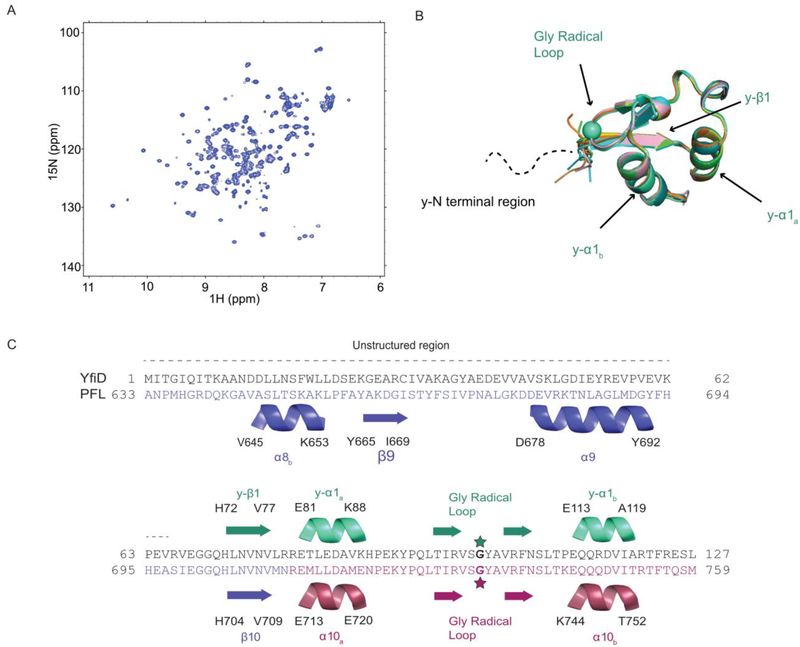
Figure 3:
Solution structure of YfiD. A) HSQC of YfiD. B) Ten lowest energy NMR structures of residues 68–127 of YfiD (PDB ID 60WR; backbone RMSD 0.07 Å). The N-terminal region of YfiD shows fewer crosspeaks and is unable to be assigned, thus indicating this region is disordered, as depicted by the dotted line. C) Sequence and secondary structure of YfiD (cyan) and residues 633–679 of PFL (colored as in Figure 2).

