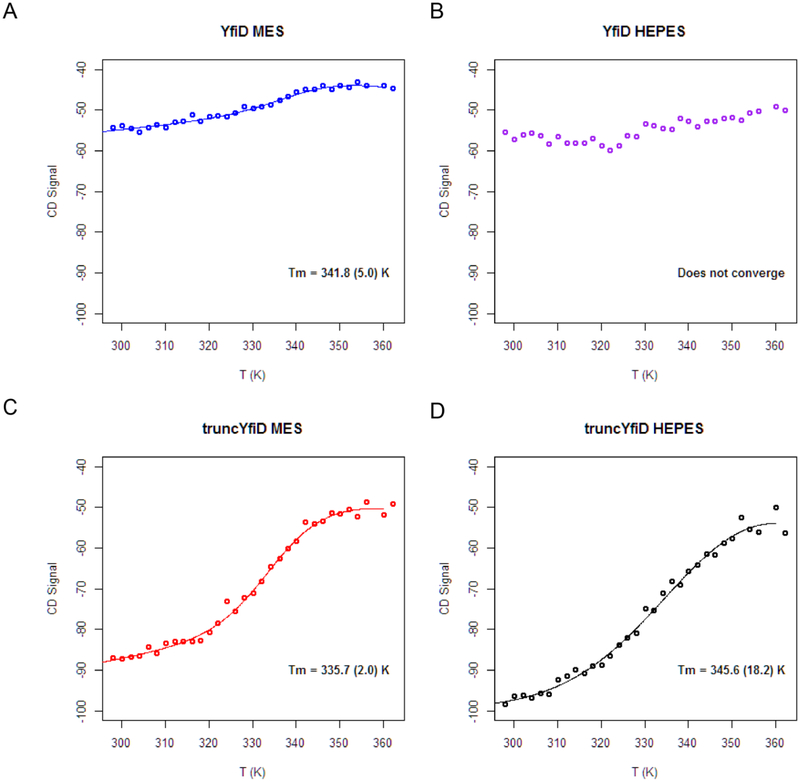
Figure 4:
Circular dichroism spectroscopy thermal denaturation measurements for YfiD in the presence and absence of the first 60 residues. A) and B) The thermal denaturation curves for intact YfiD in two different buffers (MES, pH 6.5 and HEPES, pH 7.2). For the YfiD in HEPES buffer, a melting temperature cannot be determined as the algorithm does not converge. C) and D) The thermal dénaturation curves for a YfiD variant that is missing the first 60 residues of the protein (truncYfiD) in two buffers (MES, pH 6.5 and HEPES, pH 7.2). Tm values are listed in panels.

