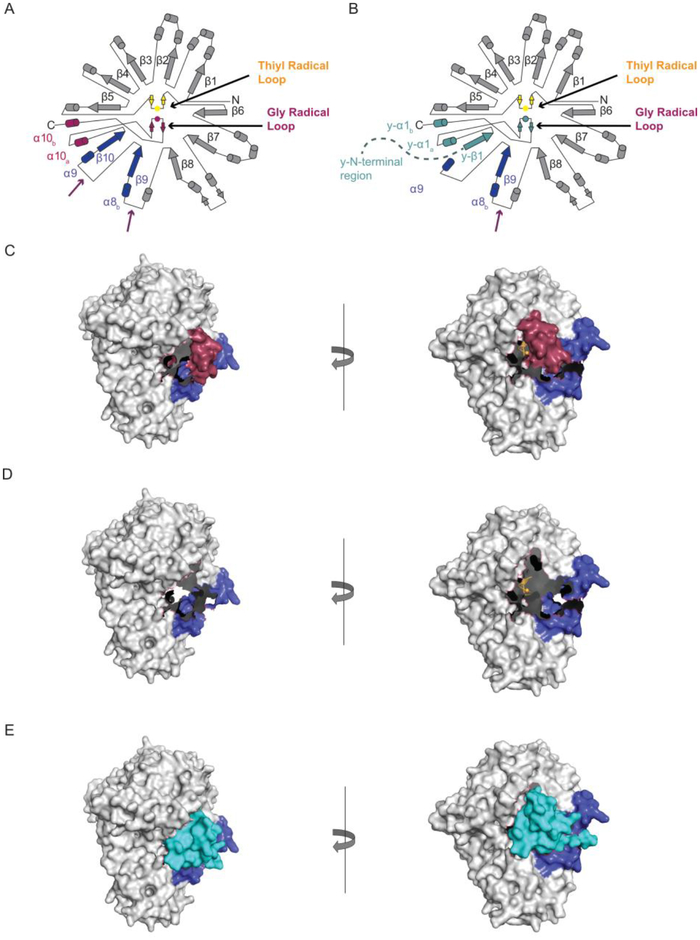
Figure 7:
Docking of YfiD to PFL variants. A) Topology diagram for PFL showing proteolytic cut sites identified in Fig. 6 (purple arrows). B) Topology diagram for YfiD (teal) bound to tlPFL. Second cut site is also shown (purple arrow). C) Space filling depiction of cPFL. D) Space filling depiction of tlPFL. E) YfiD manually docked into the pocket of tlPFL. On the right panel, YfiD is depicted in ribbons. PFL models generated from PDB ID: 2PFL.

