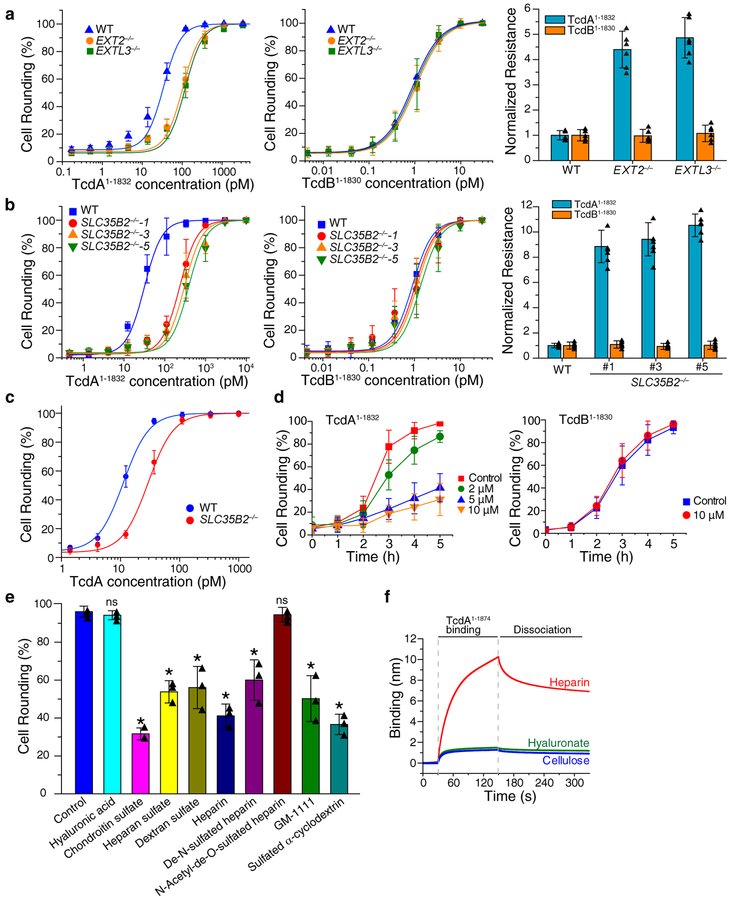
Figure 2. sGAGs contribute to cellular entry of TcdA1–1832.
a. The sensitivities of EXT2−/− and EXTL3−/− HeLa cells to TcdA1–1832 (left panel) and TcdB1–1830 (middle panel) were quantified using the cytopathic cell-rounding assay. The percentage of rounded cells were quantified, plotted, and fitted. The toxin concentrations that resulted in 50% cell-rounding is defined as CR50 and is utilized for comparison by normalizing to the level of WT HeLa cells as normalized resistance (right panel, y axis, each data point was also shown as triangle in the bar graph). Centre values represent mean. Error bars represent ± s.d. (standard deviation).
b. The sensitivities of three SLC35B2−/− HeLa cell lines to TcdA1–1832 and TcdB1–1830 were quantified using the cytopathic cell-rounding assay and normalized to the level of WT HeLa cells. Each data point was also shown as triangle in the bar graph (right panel).
c. The sensitivities of HeLa WT and SLC35B2−/− cells (clone #5) to full-length TcdA were evaluated using the cytopathic cell-rounding assays. The percentage of rounded cells were quantified, plotted, and fitted.
d. Pre-incubation of surfen in the medium reduced the potency of TcdA1–1874 but not TcdB1–1830 in a concentration-dependent manner on HeLa cells, as measured by the cytopathic cell-rounding assay over time.
e. Competition assay on HeLa cells by pre-incubating TcdA1–1874 (2 nM) with the indicated GAGs, polysaccharides and synthetic sulfated molecules (all at 1 mg/mL). The degrees of protection were evaluated by the cytopathic cell-rounding assay 4 h later. (* p < 0.005, p > 0.05 is considered as non-significant (ns), two-side Student’s t test, n=3). Each data point was also shown as triangle in the bar graph.
f. TcdA1–1874 (1 μM) strongly bound to biotin-heparin but not to biotin-hyaluronate or biotin-cellulose, measured by BLI assays. Experiments were repeated three times.
For a-d, n=6, error bar represents mean ± s.d.. The experiments were repeated three times independently with similar results.

