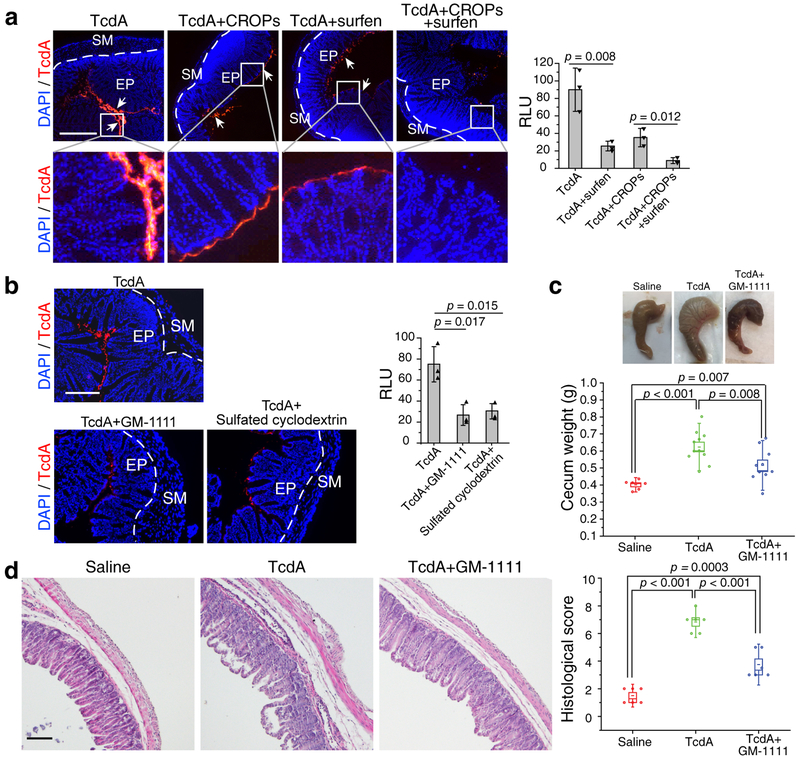
Figure 5. Blocking sGAG-TcdA interactions reduces TcdA toxicity in the colon.
a. Co-injecting either surfen (50 μM) or TcdA CROPs (150 nM) with Alexa555-labelled full-length TcdA (5 nM) partially reduces TcdA binding to the colonic epithelium. Co-injecting both surfen and TcdA CROPs with TcdA largely abolished toxin binding. Representative images were shown on the left, and quantification of binding is shown in the right panel (n=3).
b. Co-injection of GM-1111 or sulfated cyclodextrin with TcdA both reduced TcdA binding to the colonic epithelium (n=3).
c. TcdA (4 μg), TcdA premixed with GM-1111(0.5 mg/ml), or saline was injected into the cecum of mice. After 6 h, the cecum tissue was excised. The representative cecum tissues were shown, and the weight of each cecum was measured and plotted. Boxes represent mean ± SEM; the bars represent s.d.; two-sided Student’s t test. N = 6 (saline), 11 (TcdA), or 10 (TcdA+GM-1111).
d. Cecum tissues from panel c were sectioned and subjected to H&E staining. The representative images are shown and the histological scores were assessed on the basis of disruption of the epithelia, hemorrhagic congestion, mucosal edema, and inflammatory cell infiltration. Boxes represent mean ± s.e.m; the bars represent s.d.; Student’s t test.
For panels a and b: binding of TcdA was quantified using ImageJ and statistical analysis is Student’s t test (two-sided, multiple comparisons). Centre values represent mean and error bars represent ± s.d.. Each data point was also shown as triangle in the bar graph.

