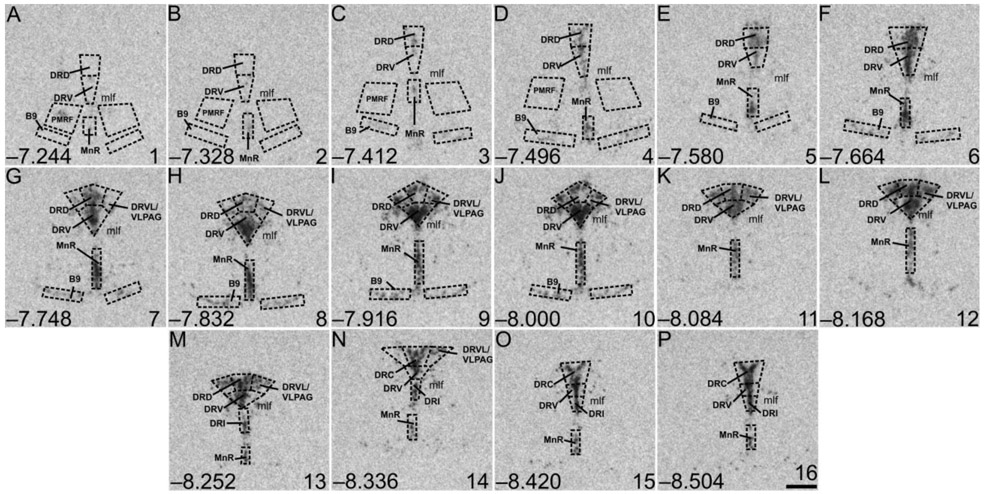
Figure 3.
Atlas of rat tryptophan hydroxylase 2 (Tph2) mRNA expression in the brainstem raphe complex (84 μm intervals) used for analysis of subregions of the dorsal raphe nucleus (DR), median raphe nucleus (MnR), B9 supralemniscal serotonergic cell group, and pontomesencephalic reticular formation (PMRF) with a high level of neuroanatomical resolution. Photographs are autoradiographic images of Tph2 mRNA expression from a single rat in this study. The levels chosen for analysis ranged from (A) −7.244 mm bregma through (P) −8.504 mm bregma; bregma levels are listed in the lower left of each panel. Numbers in the lower right of each panel (1-16) correspond to rostrocaudal levels on the x-axis for Figure 4A and Supplemental Figure 1A-H. Dotted lines delineate different subdivisions of the DR, the MnR, B9 serotonergic cell group, and PMRF analyzed in this study, based on a stereotaxic atlas of the rat brain (Paxinos and Watson, 1998). Abbreviations: B9, supralemniscal serotonergic cell group; DRC, dorsal raphe nucleus, caudal part; DRD, dorsal raphe nucleus, dorsal part; DRI, dorsal raphe nucleus, interfascicular part; DRV, dorsal raphe nucleus, ventral part; DRVL/VLPAG, dorsal raphe nucleus, ventrolateral part/ventrolateral periaqueductal gray; mlf, medial longitudinal fasciculus; MnR, median raphe nucleus; PMRF pontomesencephalic reticular formation. Scale bar, 500 μm

