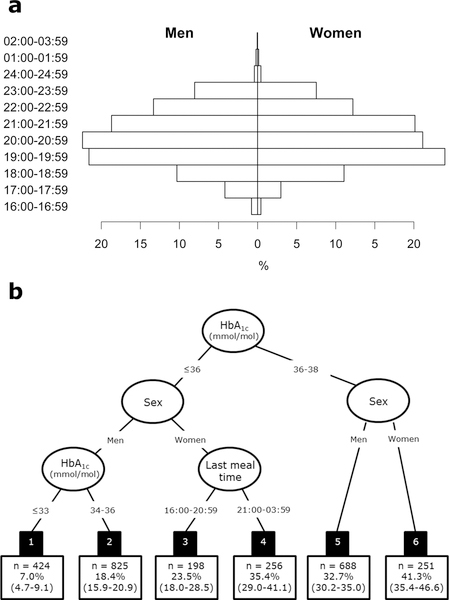
FIGURE 1.
Distribution of time of last meal among 1937 men and 705 women with normoglycaemia at baseline (a). Recursive partitioning model (survival tree) for progression from normoglycaemia to prediabetes or diabetes (b). The black boxes are the six terminal subgroups of the tree, each with the number of participants (n) and their estimated 5-year probability of progressing to prediabetes or diabetes with 95% confidence intervals.

