
Figure 1.
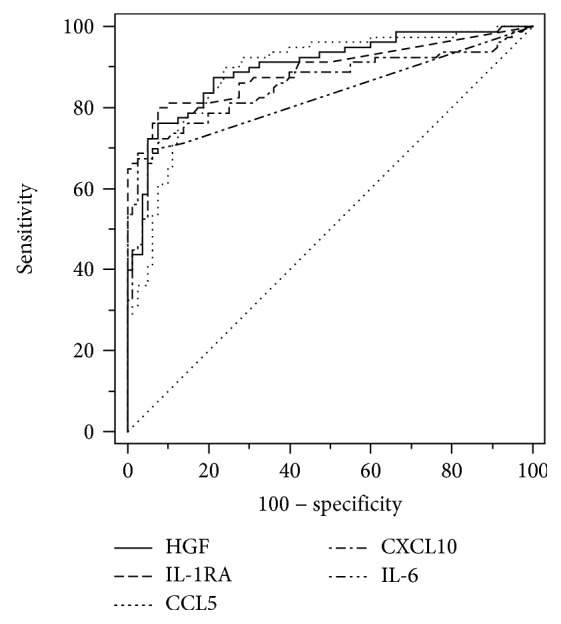
Receiver operating characteristic curves for the diagnosis of sepsis that showed the highest values among tested molecules. Comparison of HGF and IL6 (P = 0.042) and IL-1RA and IL-6 (P = 0.028) revealed statistical significance.
Official websites use .gov
A
.gov website belongs to an official
government organization in the United States.
Secure .gov websites use HTTPS
A lock (
) or https:// means you've safely
connected to the .gov website. Share sensitive
information only on official, secure websites.
Receiver operating characteristic curves for the diagnosis of sepsis that showed the highest values among tested molecules. Comparison of HGF and IL6 (P = 0.042) and IL-1RA and IL-6 (P = 0.028) revealed statistical significance.