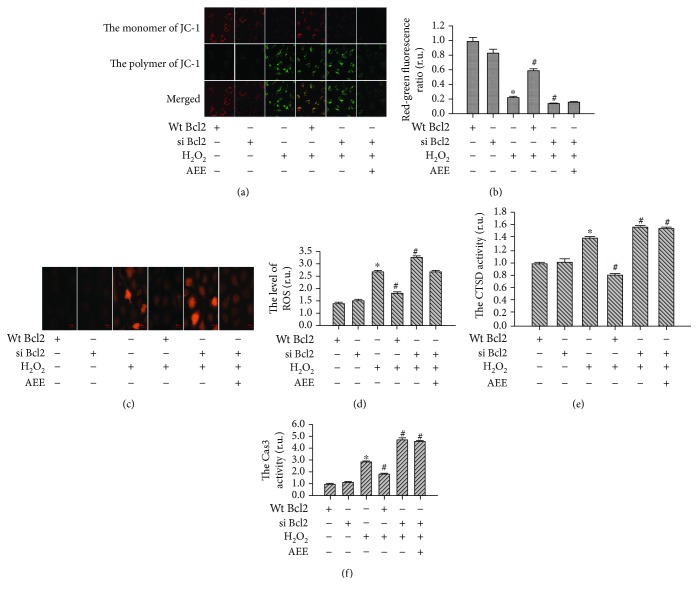
Figure 6.
Genetic inhibition of Bcl2 reduced the effect of AEE on H2O2-induced mitochondrial and lysosomal dysfunction. (a, b) The changes in the mitochondrial membrane potential between different treatment groups ((a) 10 × 40 power). (c, d) The changes in ROS production between different treatment groups ((c) 10 × 40 power). (e, f) The changes in CTSD and Cas3 activity among different treatment groups. “+” with the treatment in the HUVECs; “-” without the treatment in the HUVECs. Values are expressed as mean ± SD, n = 6; ∗p < 0.05, compared with the group of overexpression alone; #p < 0.05, compared with the group of H2O2 alone (one-way ANOVA followed with Duncan's multiple comparisons).

