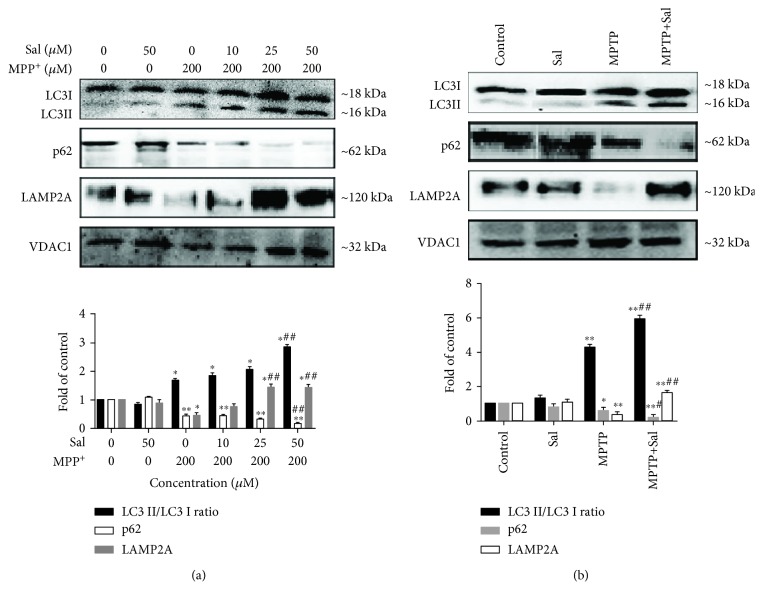
Figure 5.
Regulation of LC3, p62, and LAMP2A expression. Regulation of the ratio of LC3II/LC3I, p62, and LAMP2A expression in the mitochondria of MN9D cells (a) and the SN of mice (b). Each column represents the mean ± SD (n = 3). ∗P < 0.05 and ∗∗P < 0.01, compared with the control group; #P < 0.05 and ##P < 0.01, compared with the MPP+/MPTP-treated group.

