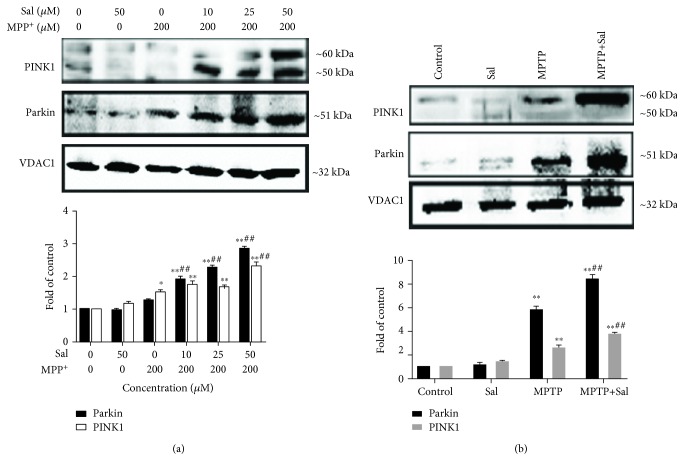
Figure 7.
Regulation of PINK1 and Parkin expression. Regulation of PINK1 and Parkin expression in the mitochondria of MN9D cells (a) and the SN of mice (b). VDAC1 served as loading controls. Each column represents the mean ± SD (n = 3). ∗P < 0.05 and ∗∗P < 0.01, compared with the control group; #P < 0.05 and ##P < 0.01, compared with the MPP+/MPTP-treated group.

