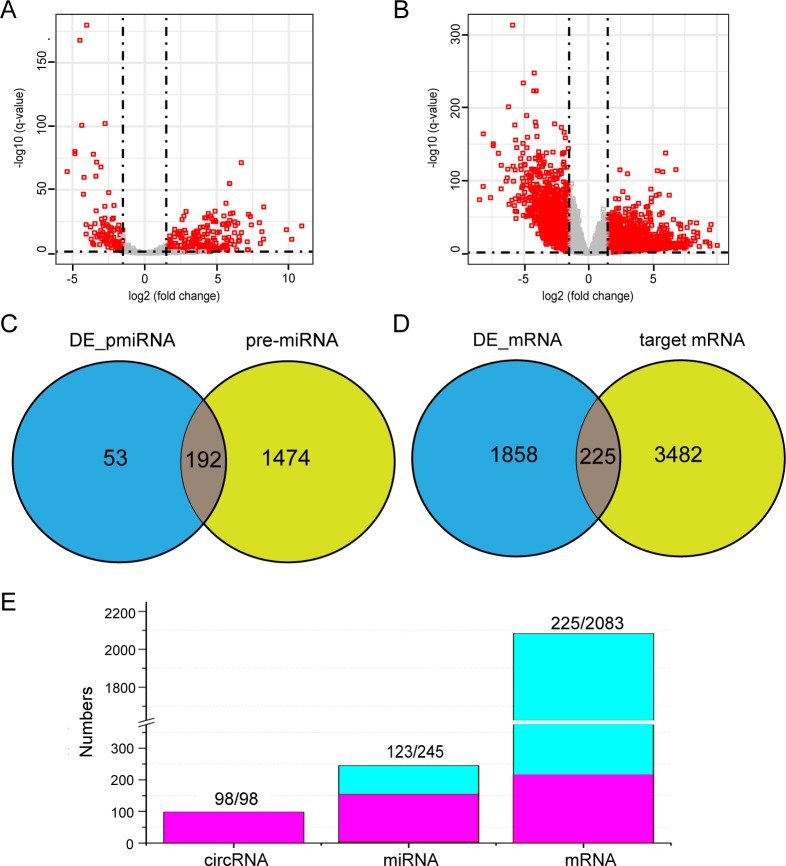
Figure 3. Differential expression analysis and interaction analysis of miRNAs and mRNAs.
Volcano plots showing expression profile of pre-miRNAs (A) and mRNAs (B). (C) The intersection of the differentially expressed pre-miRNAs (DE_pmiRNA) and 1,666 pre-miRNAs. (D) The intersection of the differentially expressed mRNA (DE_mRNA) and 3707 miRNA target genes. (E) Comparison of data sizes before and after data processing. Purple indicates retained data and blue indicates discarded data.

