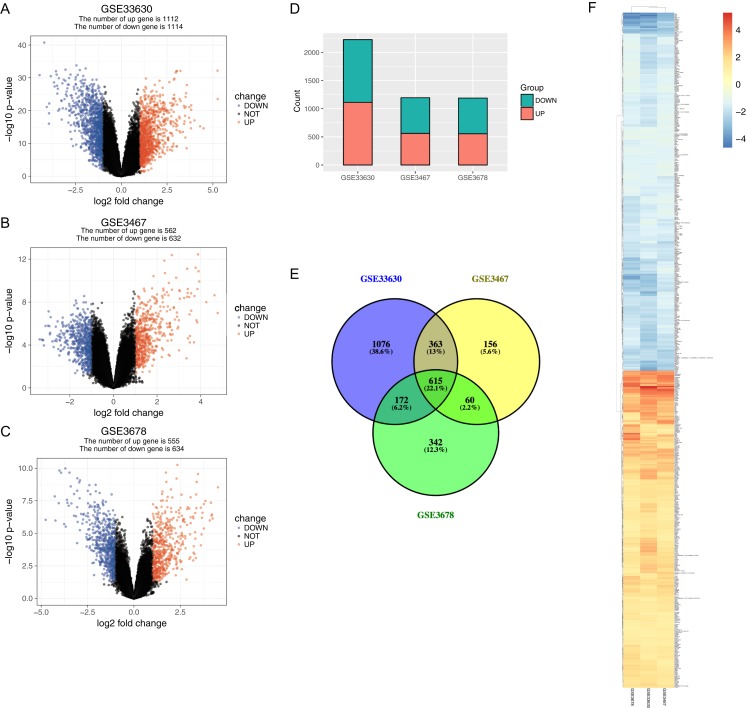
Figure 2. Gene expression of each dataset.
(A–C) Volcano graph displaying pairs of expressed genes. Red dots indicate significantly up-regulated differential expressed genes and blue dots indicate significantly down-regulated DEGs that passed the screening threshold. (D) Differential expressed gene counts of each dataset. (E) Venn analysis among DEGs of three datastes. (F) Heatmap and hierarchical clustering of identified DEGs. Up- or down-regulated genes are colored in red or blue.

