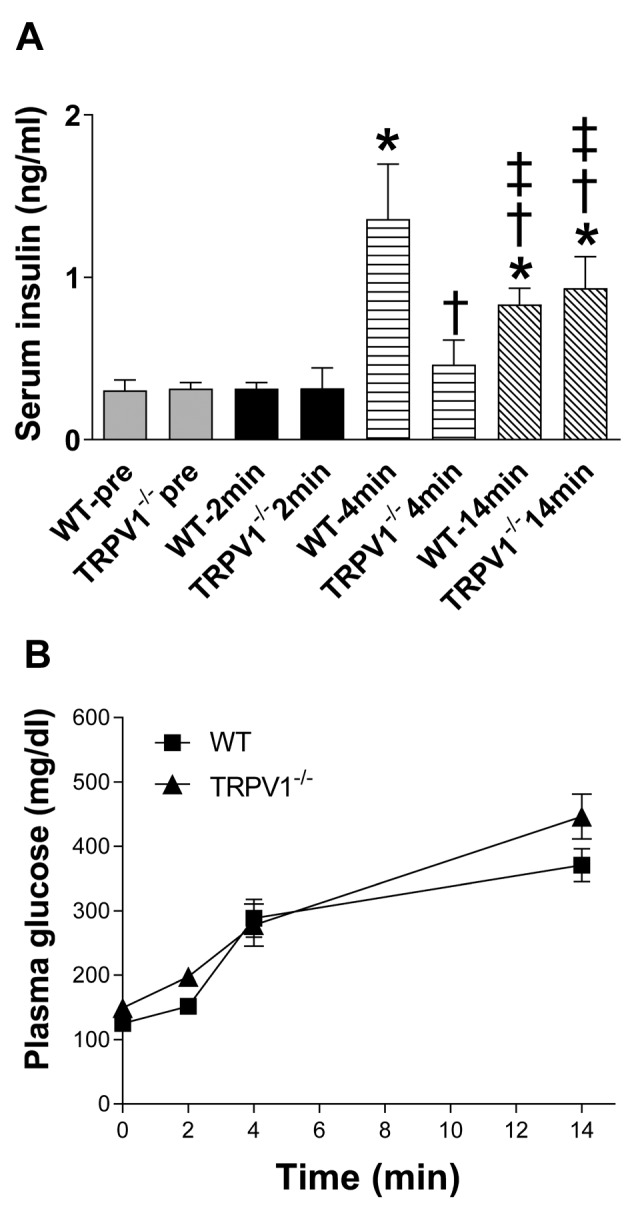
Figure 2. Acute phase insulin secretory response. Plasma levels of insulin (A) and glucose (B) were measured in WT and TRPV1–/– mice before (pre) and at 2, 4, and 14 min after glucose injection (3 g/kg body weight, i.p.). Values are mean±SEM; n=5-8; * p<0.05 vs. WT-pre, TRPV1–/–-pre, WT-2 min, TRPV1–/–-2 min; †p<0.05 vs. WT-4 min; ‡p<0.05 vs. TRPV1–/–-4 min.

