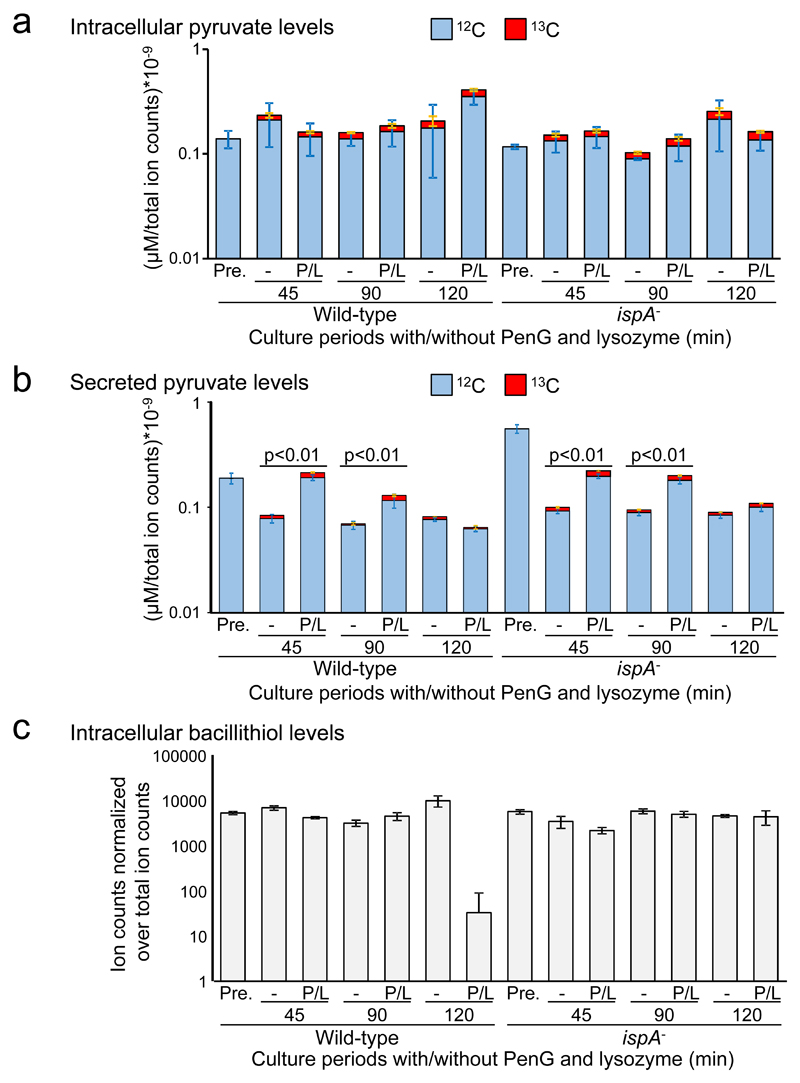
Figure 4. Increase in glycolytic flux and ROS toxicity during L-form transitions.
a, b, Effects of the L-form transition on glycolysis in B. subtilis. The charts show the pool size of labelled (13C, red) and unlabelled (12C, blue) intracellular pyruvate (a), or secreted extracellular pyruvate (b) from ~108 cells of B. subtilis wild-type (168CA) and ispA- (RM81) cultures in NB/glucose with or without PenG (P) and lysozyme (L). Pre-cultures of B. subtilis in the presence 0.4 M unlabelled glucose were also analysed as a control for the pyruvate levels before incubation in the presence of labelled glucose (Pre.). The concentrations were normalised over total ion counts. The bars represent the averages and the standard deviation from four biological replicates. The p value (two-sided) was calculated using a student t test. To ensure that cell lysis did not contribute to the extracellular values we also measured succinate and found diminished (rather than increased) extracellular levels in the presence of PenG and lysozyme (Supplementary Table 1).
c, Effects of the L-form transition on intracellular bacillithiol. Samples from the above experiment were analysed for total pool size of intracellular bacillithiol from ~108 cells of B. subtilis cultures. The identification of bacillithiol was based on m/z ion counts, which were normalised over total ion counts. The bars represent the averages and the standard deviation from four biological replicates.

