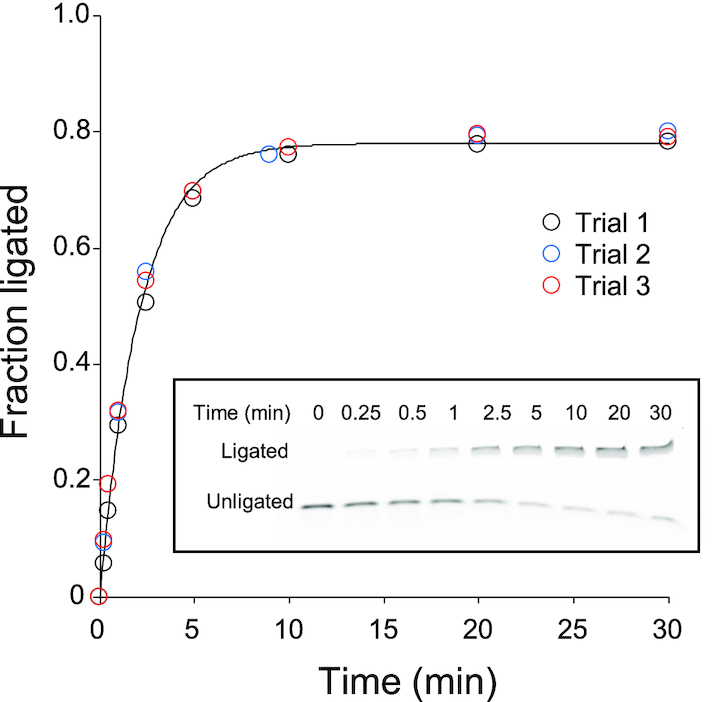
Figure 4.

Ligation reaction of minF1 and FAM-F1*subA (FAM: 6-fluorescein label). minF1 was in excess and the samples were analyzed by denaturing PAGE. FAM fluorescence was detected by a gel imager. The experiment was repeated three times, and the data were fitted to the equation FL = Fmax(1 – e−kobst) which is represented by the solid curve. A representative gel electrophoregram is shown in inset.
