
Figure 3.
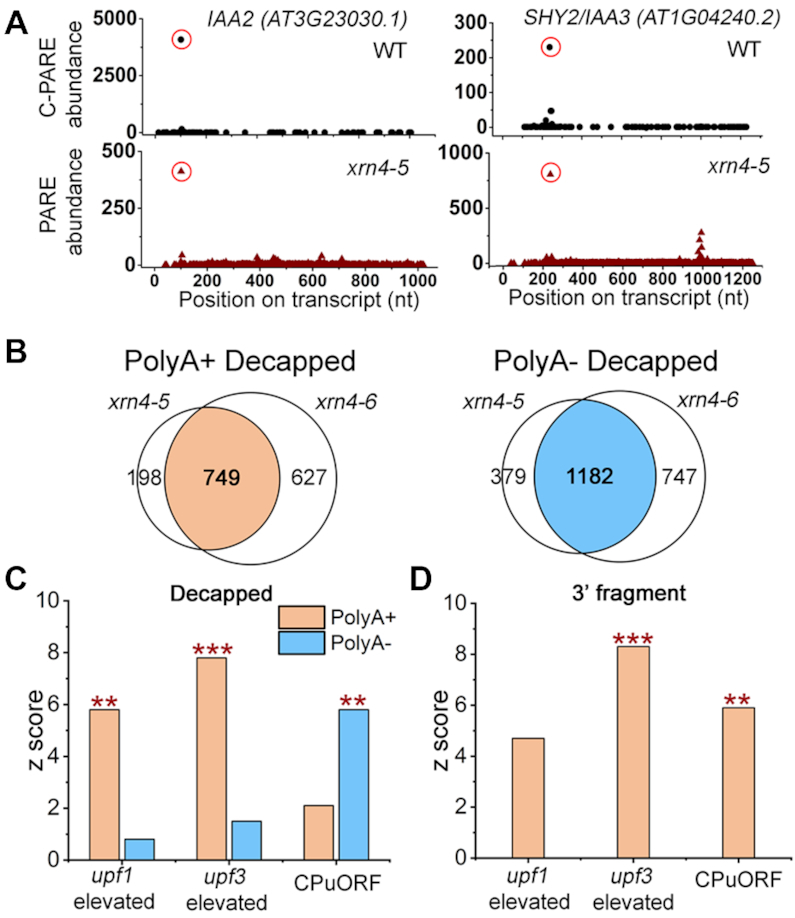
XRN4 substrates include decapped intermediates and 3′ fragments of select RNAs. (A) D-plots of IAA2 and SHY2/IAA3 mRNAs show profiles from C-PARE (WT, top) and polyA- PARE (xrn4–5, bottom). Red open circles indicate the cap sites (top) and polyA- MaxSeqs that precisely coincide with cap sites (bottom). (B) Weighted Venn diagrams show overlap between xrn4–5 and xrn4–6, of elevated MaxSeqs that match exactly to cap sites and represent decapped intermediates from unique transcripts in polyA+ or polyA- PARE libraries. The overlap between the two mutants corresponds to decapped XRN4 substrates resulting from the pipeline in Supplementary Figure S7. (C) Overlap between NMD-sensitive transcripts and decapped XRN4 substrates. (D) Overlap between NMD-sensitive transcripts and 3′ fragments overaccumulating in xrn4 polyA+ PARE. For (C and D), CPuORFs, and upf1- and upf3-elevated datasets are described in Supplementary Table S4. Y-axis, z-scores were generated by the GeneSect program and significant overlaps between datasets are indicated by P-values (**, P< 0.01; ***, P < 0.001). For panel (D), in both xrn4 mutants MaxSeq at the same site, abundance ≥ 20 TP20M and ≥2 fold change as described in Supplementary Experimental Procedures.