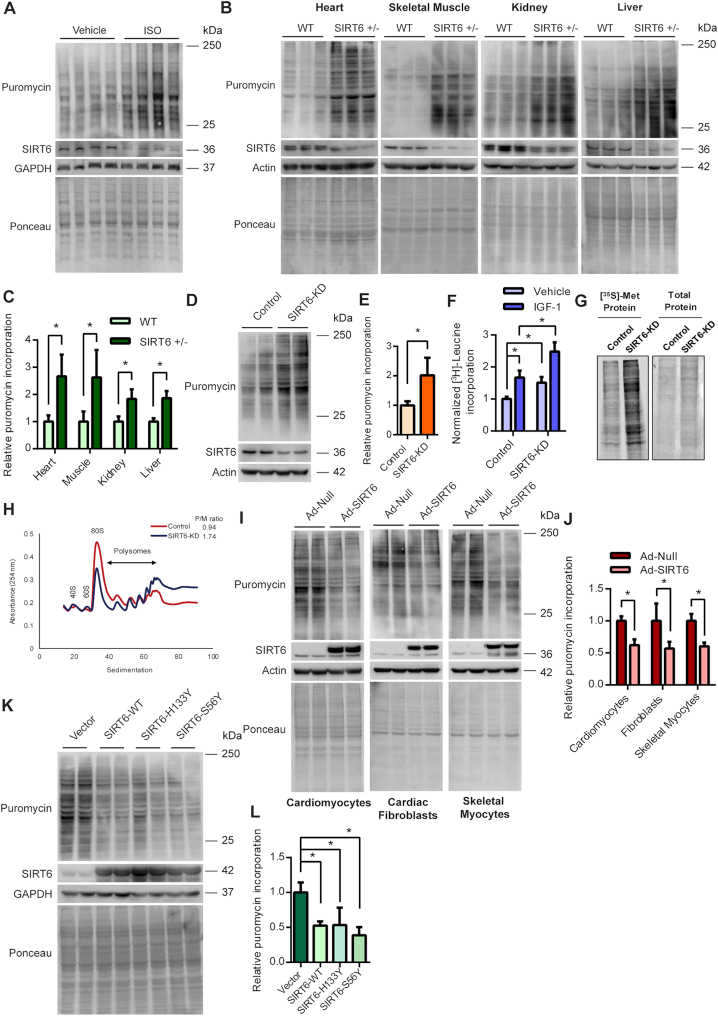
Figure 1.
(A) Western blotting analysis depicting the changes in protein synthesis rates (tracked using SUnSET assay) and concomitant changes in SIRT6 levels in heart tissue of ISO administered mice. (B) Representative images of western blotting SUnSET analysis depicting changes in protein synthesis rates in heart, skeletal muscle, kidney and liver tissues of WT and SIRT6 heterozygous (SIRT6 +/–) mice. (C) Quantitative representation of puromycin incorporation depicted in Figure 1B. The results are expressed as the fold change relative to wild-type controls. n = 6 mice per group. Data are presented as mean ± s.d, *P < 0.05. (D) Representative images of western blotting SUnSET analysis of control and SIRT6-depleted (SIRT6-KD) neonatal rat cardiomyocytes. SIRT6 was depleted using specific siRNA and the knockdown was confirmed by immunoblotting for SIRT6. (E) Quantitative representation of puromycin incorporation depicted in Figure 1D. The results are expressed as the fold change relative to control cells. n = 5. Data are presented as mean ± s.d, *P < 0.05. (F) Protein synthesis rates assessed by [3H]-leucine incorporation in control or SIRT6-KD neonatal rat cardiomyocytes in the presence of vehicle or 20 ng/ml of IGF-1. [3H]-leucine incorporation was normalized against the DNA content. The results are expressed as the fold change relative to vehicle-treated control cells. n = 6. Data are presented as mean ± s.d, *P < 0.05. (G) Representative images of protein synthesis rates observed using [35S]-Methionine incorporation in control and SIRT6 stable knockdown (SIRT6-KD) 293T cells. Coomassie staining was done to confirm equal loading. (H) Polysome profiles of control and SIRT6 stable knockdown 293T cells indicating the cellular translation rates. The polysome to monosome ratio was calculated by measuring the area under the curves representing the respective fractions. The profiles and the ratio presented here are representative of three independent experiments. SIRT6 knockdown was confirmed by western blotting and is shown in Supplemental Figure S1B. (I) Representative images of western blotting SUnSET analysis of null or SIRT6 adenovirus-infected neonatal rat cardiomyocytes, cardiac fibroblasts or skeletal myocytes. The cells were infected with adenovirus for 48 h and the expression of SIRT6 was confirmed by immunoblotting. (J) Quantitative representation of puromycin incorporation shown in Figure 1I. The results are expressed as the fold change relative to respective null adenovirus-infected cells. n = 4–5. Data are presented as mean ± s.d, *P < 0.05. (K) Representative images of western blotting SUnSET analysis in 293T cells transfected with pcDNA, SIRT6-WT, SIRT6-H133Y or SIRT6-S56Y plasmids. The plasmids were transfected for 48 h and the expression of SIRT6 and its catalytic mutants were confirmed by western blotting. (L) Quantitative representation of puromycin incorporation depicted in Figure 1K. The results are expressed as the fold change relative to respective pcDNA transfected cells. n = 4. Data are presented as mean ± s.d, *P < 0.05.

