Figure 1.
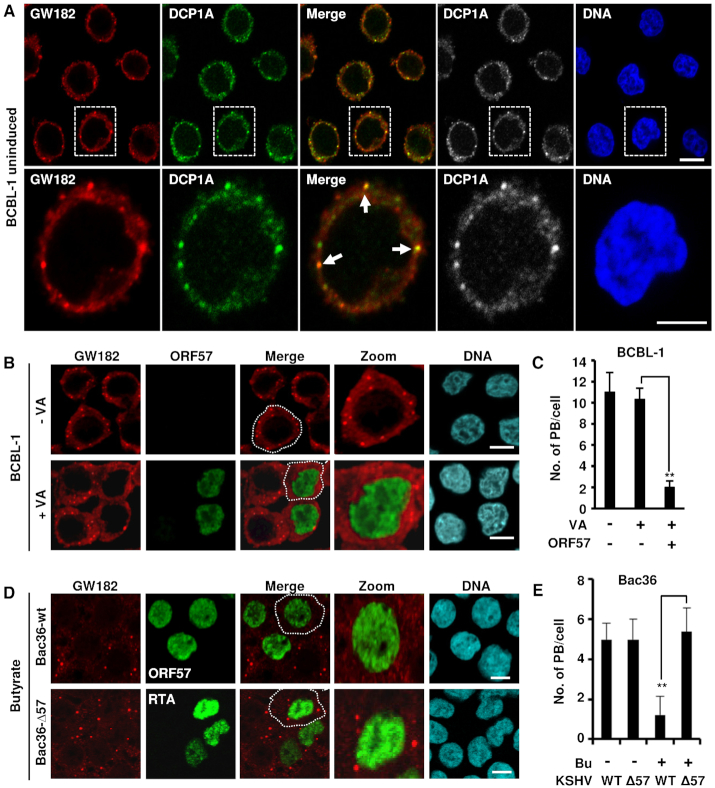
KSHV lytic infection inhibits PB formation by expression of viral ORF57. (A) GW182 and DCP1A are co-stained in the PB in BCBL-1 cells with no KSHV reactivation. BCBL-1 cells with latent KSHV infection were co-stained for GW182 (red) and DCP1A (green) using the corresponding antibodies and imaged by confocal microscopy. The nuclei were counterstained with Hoechst DNA stain. Arrows indicate the PB positively co-stained for both GW182 and DCP1A; bar = 5 μm. (B and C) Detection of PB during KSHV latent and lytic infection. (B) KSHV-infected BCBL-1 cells were induced with 1 mM valproic acid (VA, 1 mM) for lytic infection. Twenty-four hours after induction, BCBL-1 cells with (+VA) or without (-VA) virus lytic reactivation were co-immunostained for PB formation using a specific PB marker GW182 and for viral lytic protein ORF57 expression. The nuclei were counterstained with Hoechst dye. Images were captured by confocal microscopy; bar = 10 μm. (C) Number of PB in BCBL-1 cells during latent and lytic KSHV infection in the presence or absence of viral ORF57. Total of 50 cells in each group were counted in each experiment. The error bars represent SD from three independent experiments; **P < 0.01 in Student’s t-test. (D and E) ORF57, but not KSHV replication and transcription activator (RTA), suppresses PB formation during KSHV lytic infection in Bac36 cells. (D) Bac36 cells harboring a wild-type (wt) or ORF57-null KSHV genome (Δ57) (41) were induced by sodium butyrate (Bu, 3 mM). The cells with Bu induction for 24 h were then co-immunostained for the PB-specific marker GW182 and viral lytic protein ORF57 (Bac36-wt cells) or RTA (Bac36-Δ57 cells). The nuclei were counterstained with Hoechst dye. Images were obtained by confocal microscopy; bar = 10 μm. (E) Number of PB in Bac36-wt cells or Bac36-Δ57 cells during latent and lytic KSHV infection. Total of 50 cells in each group, including ORF57-positive Bac36-wt cells versus RTA-positive Bac36-Δ57 cells after lytic reactivation, were counted in each experiment. The error bars represent SD from three independent experiments; **P < 0.01 in Student’s t-test.

