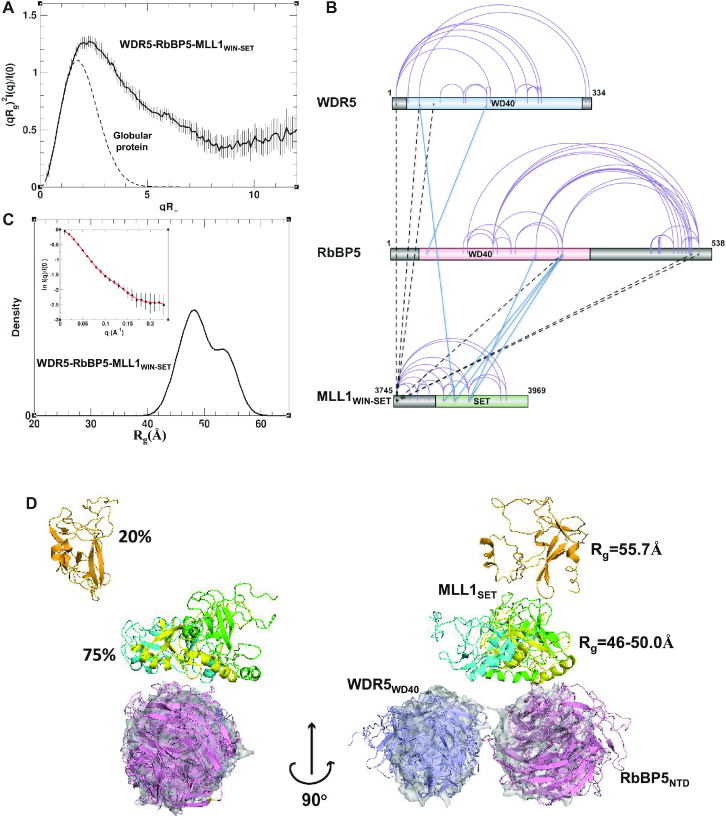
Figure 4.
Dynamic model of the trimeric WDR5–RbBP5–MLL1WIN-SET complex derived from SAXS and cross-link data. (A) Rg-based Kratky plot of SAXS data for WDR5–RbBP5–MLL1WIN-SET indicates a high degree of flexibility. (B) Sequence mapping of intraprotein and interprotein cross-links. Intraprotein cross-links are indicated with purple arcs, while interprotein cross-links between globular domains or flexible regions are indicated with blue and dashed-black lines, respectively. (C) Rg distribution for the optimal ensemble of the trimer is shown by a solid black line. Experimental SAXS profile (black circles) plotted with theoretical profiles (red line) averaged over the ensemble (inset). (D) Cartoon diagram of the four most populated models of the optimal ensemble. Only structured domains are shown. The WD40 domains of RbBP5 and WDR5 are colored in pink and blue, respectively, while MLL1 SET domain is colored differently in each model (green, cyan, yellow and orange). For reference, the WD40 domains of each model are superimposed with the most populated model of the WDR5–RbBP5 dimer (Figure 3) displayed in a semi-transparent surface representation (gray).

