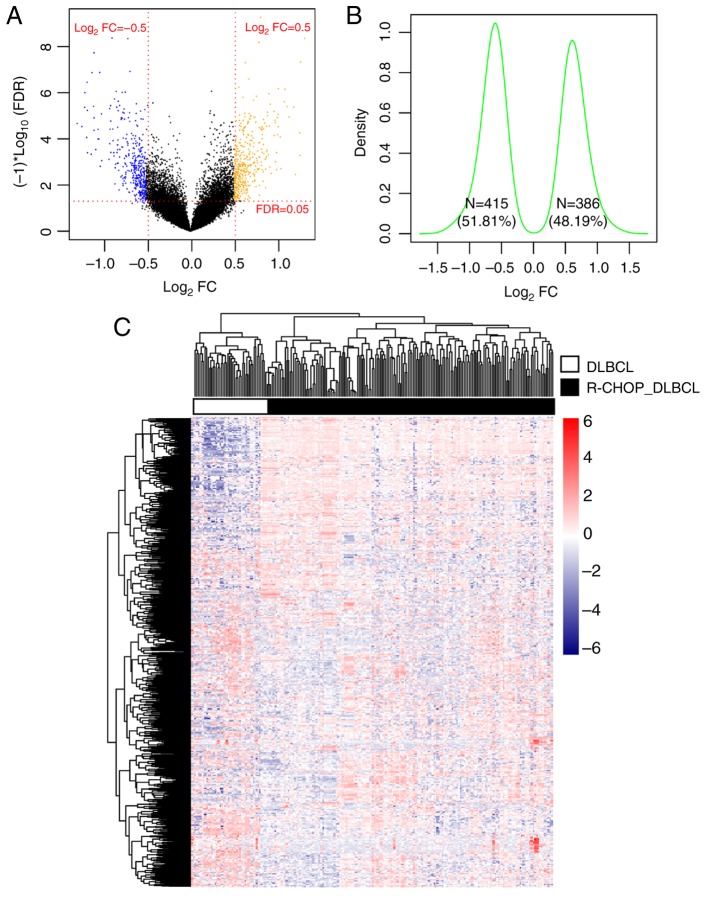
Figure 2.
Results of screening for DEG. (A) Volcano plot. Orange and blue dots indicate significantly upregulated and downregulated DEGs, respectively. The red dotted horizontal line indicates an FDR<0.05 and the two red dotted vertical lines indicate |logFC|>0.5. (B) Log2 Kernel density curve based on DEGs. (C) Bidirectional hierarchical clustering heatmap based on the expression level of the DEGs. The heatmap colors indicate the expression level; blue indicates low expression while red indicates high expression. DEGs, differentially expressed genes; FDR, false discovery rate; FC, fold change; DLBCL, diffuse large B-cell lymphoma; R-CHOP, rituximab plus cyclophosphamide, doxorubicin, vincristine, and prednisone immunochemotherapy.

