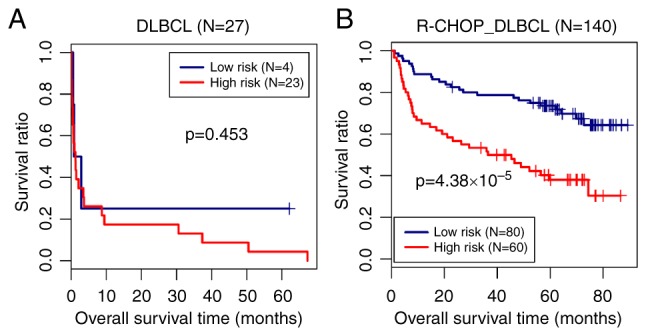
Figure 5.

Prediction model and the overall survival Kaplan-Meier curves. Overall survival Kaplan-Meier curves based on the optimal gene combination in (A) DLBCL and (B) R-CHOP treated DLBCL samples. Blue and red curves represent the low risk score and high risk score groups, respectively. DLBCL, diffuse large B-cell lymphoma; R-CHOP, rituximab plus cyclophosphamide, doxorubicin, vincristine, and prednisone immunochemotherapy.
