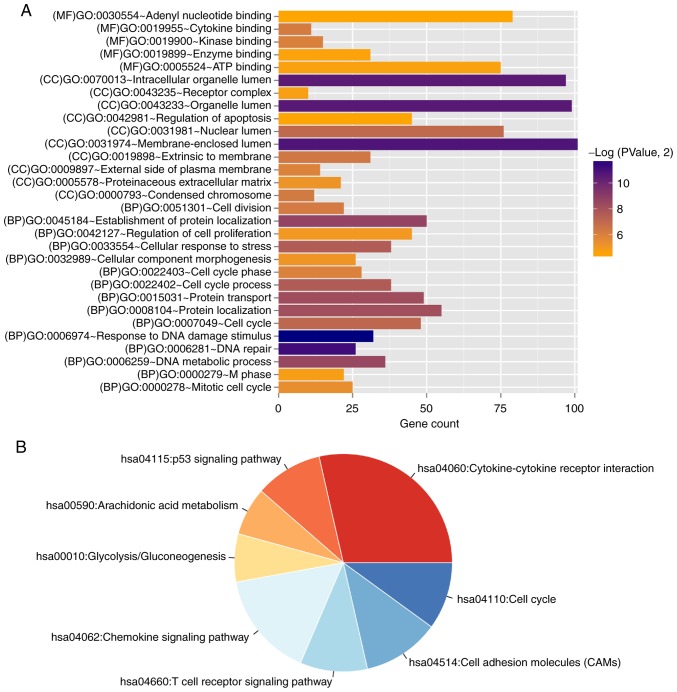
Figure 7.
Gene enrichment analysis. (A) Bar graph of the GO terms significantly associated with the differentially expressed genes. The horizontal axis represents the number of genes and the vertical axis shows the term. The color of the bars indicates the significance level. (B) Pie chart of KEGG pathways identified. Each segment represents a different KEGG pathway. The colors represent significant P-values (P<0.05) for each section; red low P-value, blue high P-value. KEGG, Kyoto Encyclopedia of Genes and Genomes; MF, molecular function; GO, Gene Ontology; CC, cellular component; BP, biological process.

