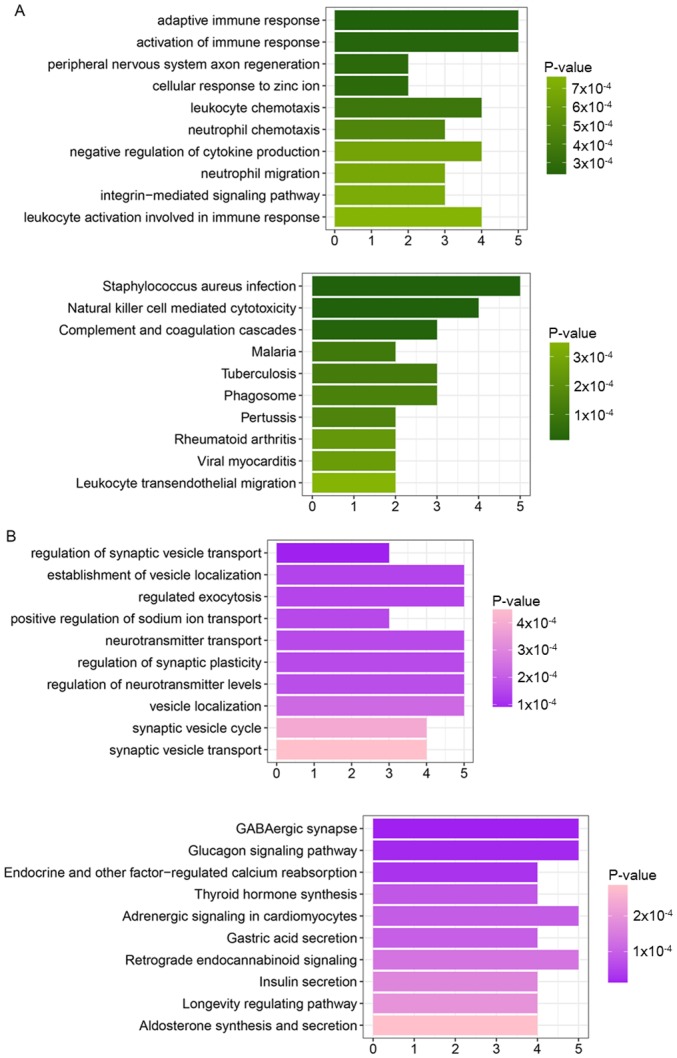
Figure 2.

KEGG pathways enriched for (A) cluster 1 and (B) cluster 2. The horizontal axes represent the number of enriched genes, and the vertical axes represent the names of KEGG pathways. The darker colors represent decreased P-values. KEGG, Kyoto Encyclopedia of Genes and Genomes.
