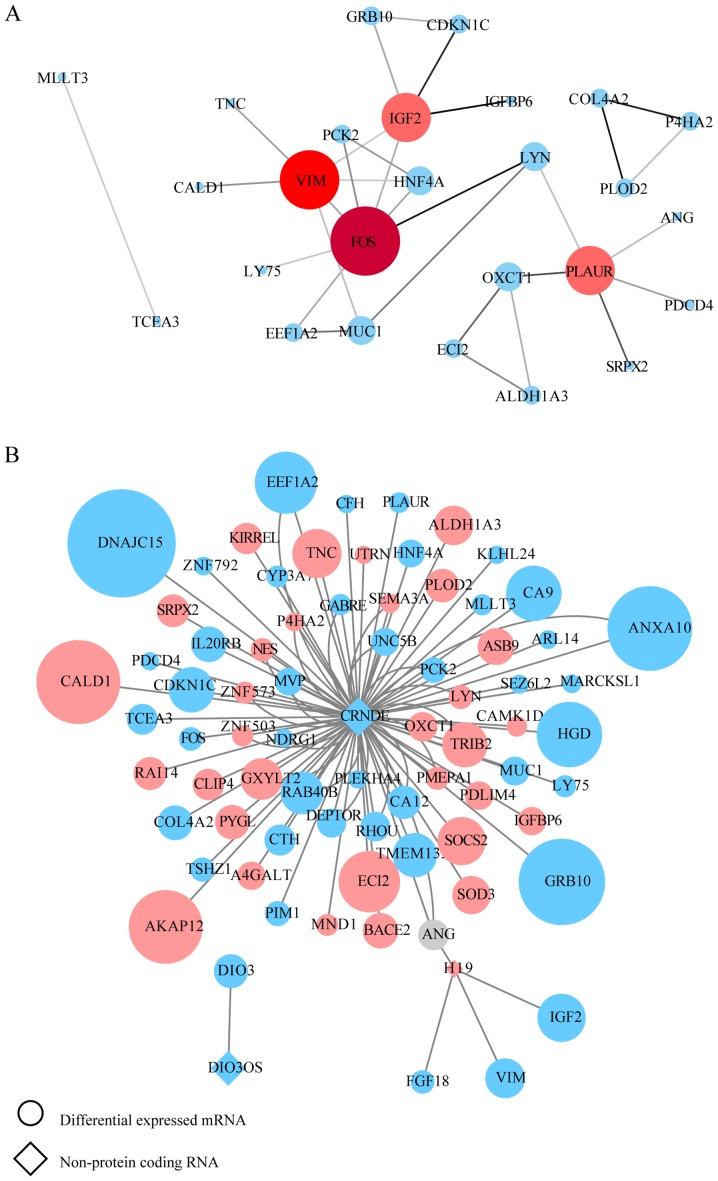
Figure 2.
PPI network construction for the OxPt resistance group. (A) PPI network for screened lncRNA-targeted DEGs. Genes marked in red represent hub genes with a degree ≥5 (color and size are increased along with degree value). The darker the connection line, the greater the confidence score. (B) lncRNA-mRNA association network. Circles indicate mRNAs and diamonds indicate non-protein-coding RNAs. A larger node indicates a larger log2FC value. Upregulated genes are shown in pink and downregulated genes are shown in blue. PPI, protein-protein interaction; lncRNA, long noncoding RNA; OxPt, oxaliplatin; DEG, differentially expressed genes; FC, fold-change.

