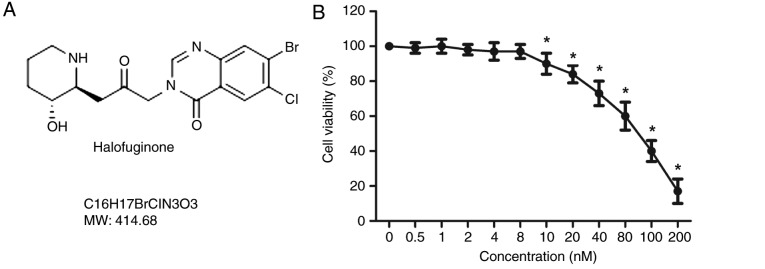
Figure 1.
Effects of HF on H9C2 cell viability. (A) Structure of HF. (B) H9C2 cells were treated with HF at various concentrations (0, 0.5, 1, 2, 4, 8, 10, 20, 40, 80, 100 and 200 nM) for 48 h; cell viability was measured using an MTT assay. HF, halofuginone; MW, molecular weight. *P<0.05 vs. the 0 nM group.

