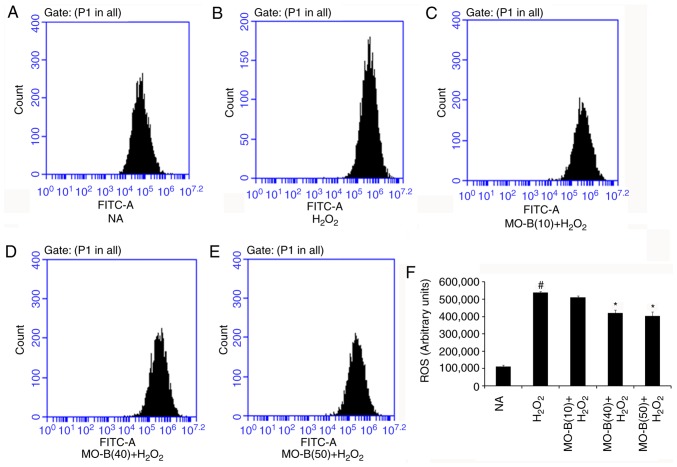
Figure 2.
Effects of MO-B on ROS generation induced by H2O2. (A) NA group. (B) H2O2 group. (C) 10 µM MO-B. (D) 40 µM MO-B. (E) 50 µM MO-B. (F) Histogram analysis of ROS generation of HUVECs. Data are expressed as means ± standard error of the mean from three independent experiments. #P<0.05 vs. NA group, *P<0.05 vs. H2O2 group. FITC, fluorescein isothiocyanate; MO-B, methylophiopogonanone B; NA, control.

