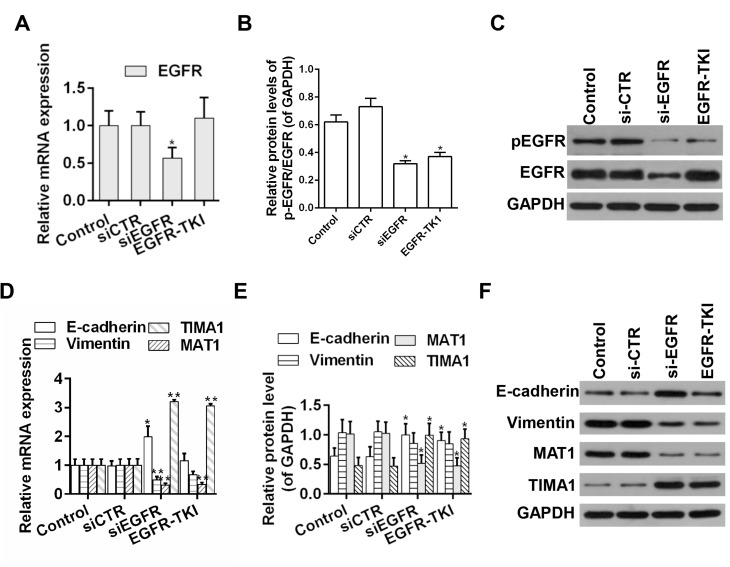
Figure 2.
Detection of the expression levels of EGFR, E-cadherin, Vimentin, MTA1 and TIAM1 in HCC tumor samples. (A) mRNA and (B) protein expression level of EGFR. (C) Western blot analysis of EGFR and p-EGFR. (D) mRNA and (E) protein expression levels of E-cadherin, Vimentin, MTA1 and TIAM1. (F) Western blot analysis of E-cadherin, Vimentin, MTA1 and TIAM1. n=3. *P<0.05, **P<0.01 vs. corresponding control. EGFR, epidermal growth factor receptor; MTA1, metastasis associated 1; TIAM1, T cell lymphoma invasion and metastasis 1; si-CTR, scrambled siRNA; si-EGFR, siRNA targeting EGFR; siRNA, small interference RNA; p-, phosphorylated; EGFR-TKI, afatinib treatment; TKI, tyrosine-kinase inhibitor.

