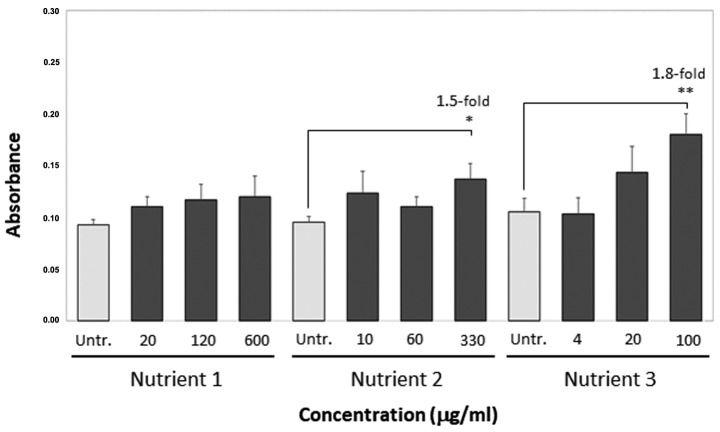
Figure 2.
Telomerase activity expressed in absorbance units (A450nm-A690nm) in the untreated cells or after treatment of PBMCs with 08AGTLF, Nutrient 1, Nutrient 2 and Nutrient 3. Error bars represents the standard deviation of the mean. Each mean was estimated from triplicate experiments. Asterisks indicate significant differences in the mean absorbance values measured after treatment with each activator compared with untreated cells (*P<0.05 and **P<0.01) at the indicated concentrations.

