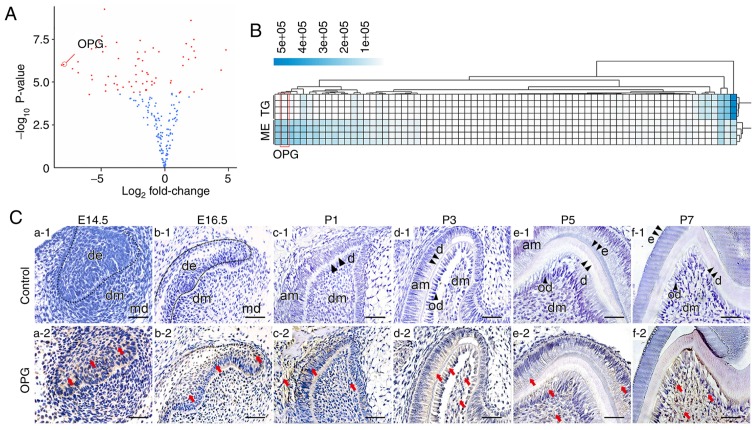
Figure 1.
Expression pattern of OPG. (A and B) Volcano plot and heatmap of differential protein expression comparing extracellular protein levels between tooth germs and samples of isolated dental mesenchyme. OPG is indicated in the figures. In the volcano plot, the log2 fold change was calculated by comparing tooth germs vs. the dental mesenchyme. Microarray analysis for tooth germs and the dental mesenchyme was performed in triplicate. (C) Spatial-temporal pattern of OPG expression during tooth development. At first, OPG expression was confined to the dental epithelium (a1 and a2). Then, OPG expression in the dental mesenchyme gradually increased as development proceeded (b-f). (C) The red arrows indicate parts of the tissue that were positive for immunohistochemical staining. Scale bar, 50 µm. OPG, osteoprotegerin; TG, tooth germ; ME, dental mesenchyme; am, ameloblasts; d, dentin; de, dental epithelium; dm, dental mesenchyme; md, mandible; od, odontoblast.

