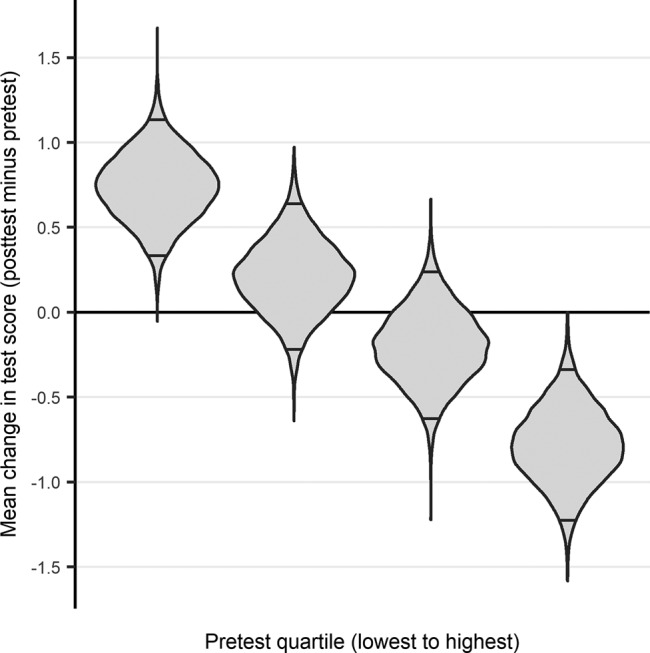
FIGURE 1.

Distributions of mean change in test score (posttest minus pretest) by pretest quartile for bivariate binomial simulated EDAT data. The model simulates 145 students, with expected mean of 3.75 points and expected pre–post correlation of 0.6. The distributions summarize mean change by quantile calculated for each of 10,000 simulations. The differences in mean change between quartile represent regression to mean, and appear solely due to chance. Of the calculated simulation means, 95% lie between the upper and lower horizontal lines within each distribution, with 2.5% at each extreme.
