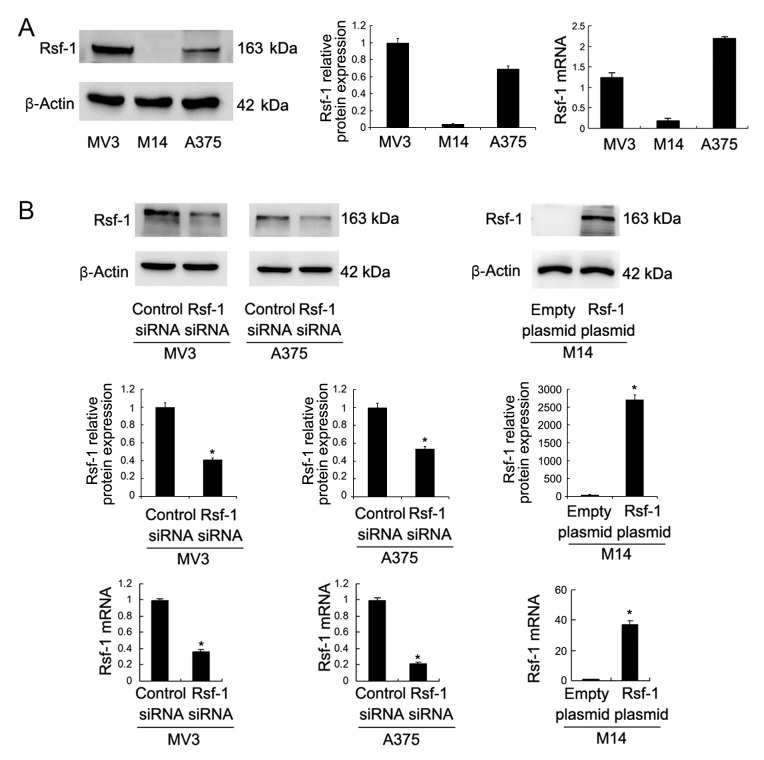
Figure 2.
Rsf-1 expression in melanoma cell lines and Rsf-1 knockdown efficiency. (A) Western blotting and RT-qPCR analysis revealed the endogenous expression levels of Rsf-1 in three melanoma cell lines (MV3, M14 and A375). (B) Western blotting and RT-qPCR analysis demonstrated that Rsf-1 siRNA transfection significantly decreased Rsf-1 expression levels in MV3 and A375 cells, while Rsf-1 plasmid transfection upregulated the protein and mRNA expression of Rsf-1 in M14 cells. Data were presented as the mean ± standard deviation of at least three experiments. *P<0.05 vs. control. Rsf-1, remodeling and spacing factor 1; RT-qPCR, reverse transcription-quantitative polymerase chain reaction; siRNA, small interfering RNA.

