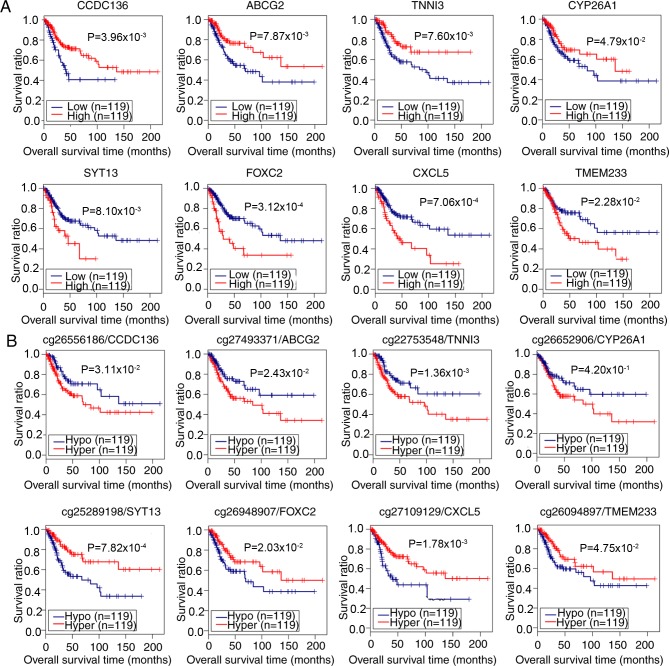
Figure 4.
Correlation analysis of the expression and methylation levels of 8 potential prognostic genes with survival of patients with CerC. (A) Correlation between the expression of 8 genes and the prognosis of patients with CerC. Red and blue lines indicate high and low expression levels, respectively. (B) Correlation between the DNA methylation level and prognosis of patients with CerC. The number prior to the gene symbols indicates the methylation loci. Red and blue lines denote hyper- and hypomethylation, respectively. Correlation analysis was performed using Kaplan-Meier survival analysis. CCDC136, coiled-coil domain containing 136 gene; ABCG2, ATP binding cassette subfamily G member 2 gene; SYT13, synaptotagmin XIII gene; TNNI3, cardiac troponin I gene; FOXC2, Forkhead 1 gene; CXCL5, epithelial neutrophil-activating peptide-78 gene; TMEM233, transmembrane protein 233 gene; CY26A1, cytochrome P450 26A1 gene; CerC, cervical cancer.

