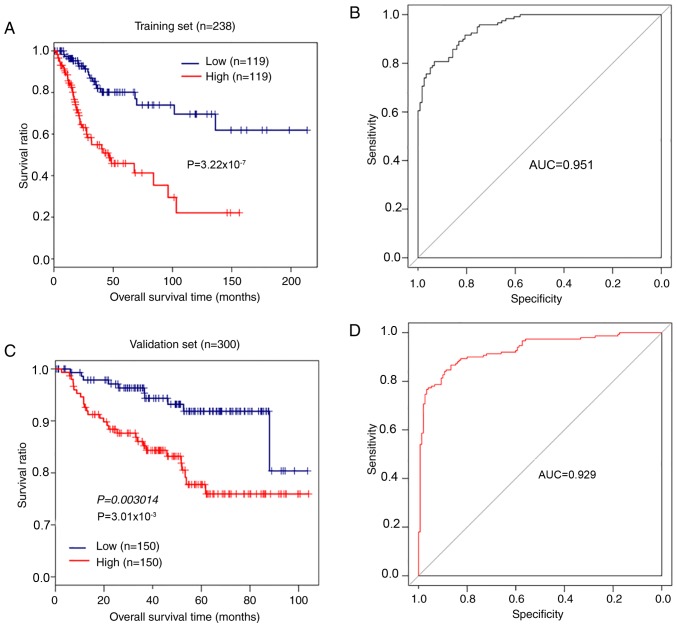
Figure 5.
Kaplan-Meier survival analysis and ROC curves for the 8-gene signature in patients with cervical cancer. (A) Kaplan-Meier survival analysis and (B) ROC curve analysis for patients in TCGA training set (n=238). (C) Kaplan-Meier survival analysis and (D) ROC curve analysis for patients in TCGA GSE44001 validation set (n=300) based on the 8-gene signature risk model. ROC, receiver operating characteristic; TCGA, The Cancer Genome Atlas; AUC, area under the curve.

